US stocks tumble after Trump threatens 25% tariffs on Japan, S. Korea
“Is it really different this time?” Stock Market (and Sentiment Results)…
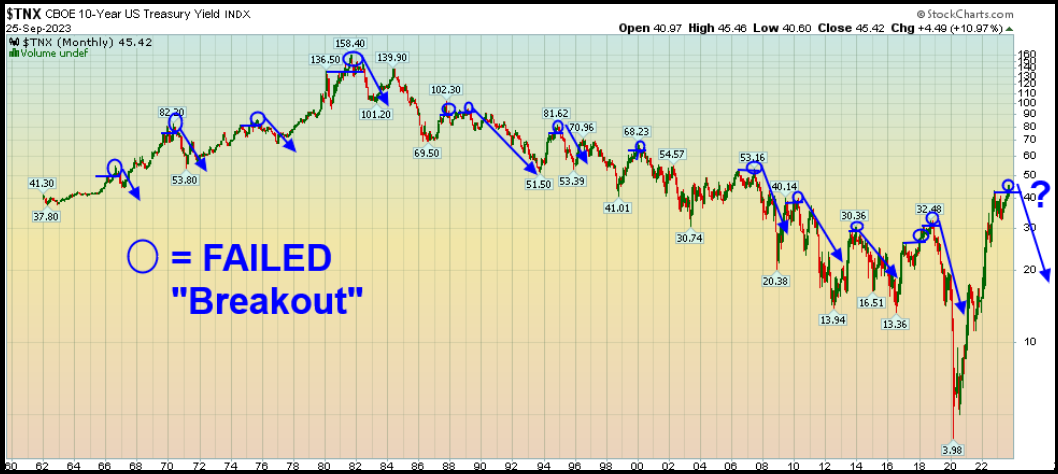
I wouldn’t make that bet. Despite 10 year yields breaking above the dreaded 4.50% level, history shows – at least 11x since 1960 that many of the “breakouts” in yields wind up actually being “fake outs” in yields. Don’t buy the hype…
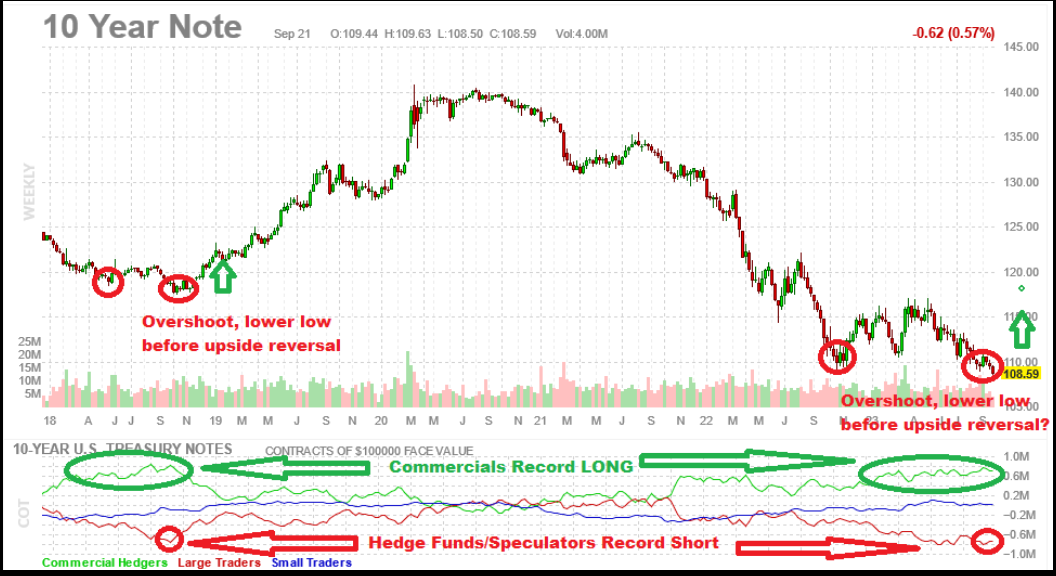
For everyone shorting bonds in the hole, keep in mind that buying “breakouts” (in yield) doesn’t always end well…
Fox Business
Yesterday I joined Liz Claman on Fox Business – The Claman Countdown – to discuss markets, outlook and picks. Thanks to Liz, Kathryn Meyers, Brad Hirst, Jake Mack, and Finley Walker for having me on:
Here were my show notes ahead of the segment:
Full Article on Barron’s
This was my response –
I agree with her US outlook. I disagree with her China outlook.
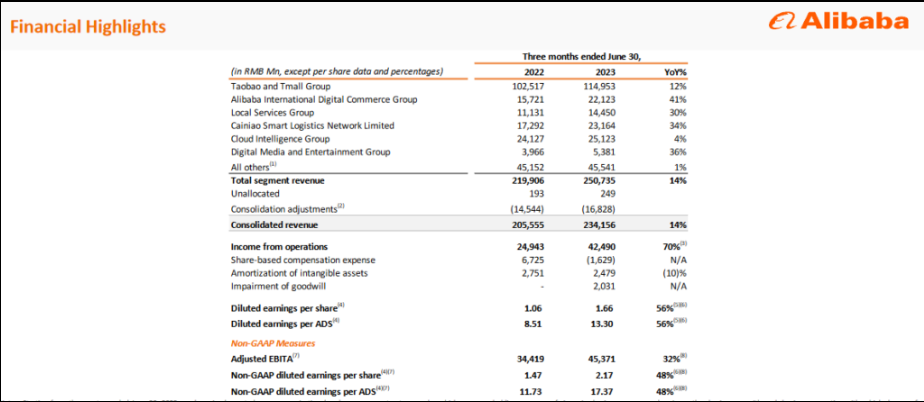
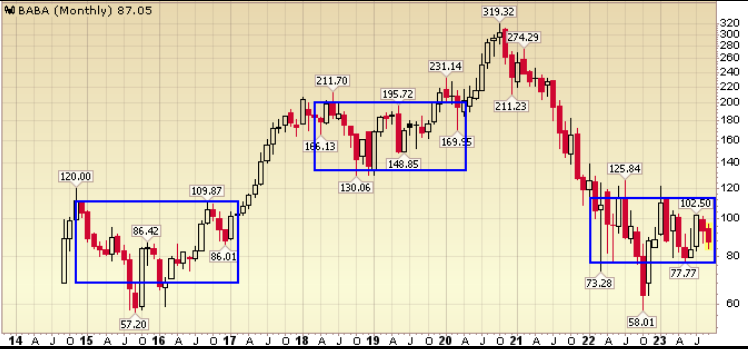
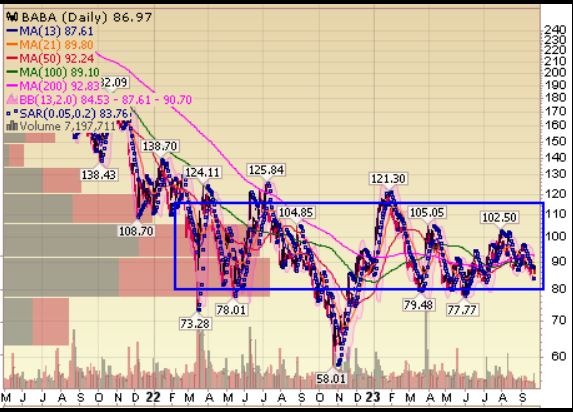
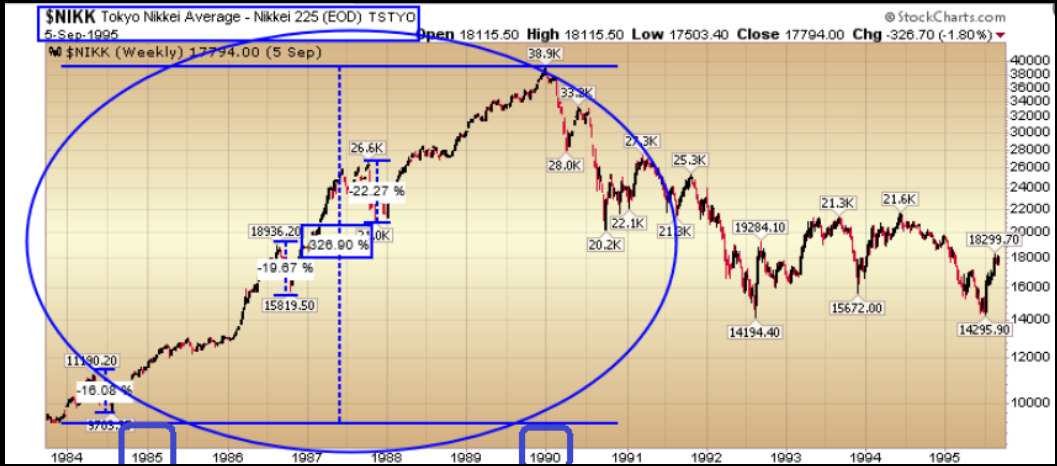
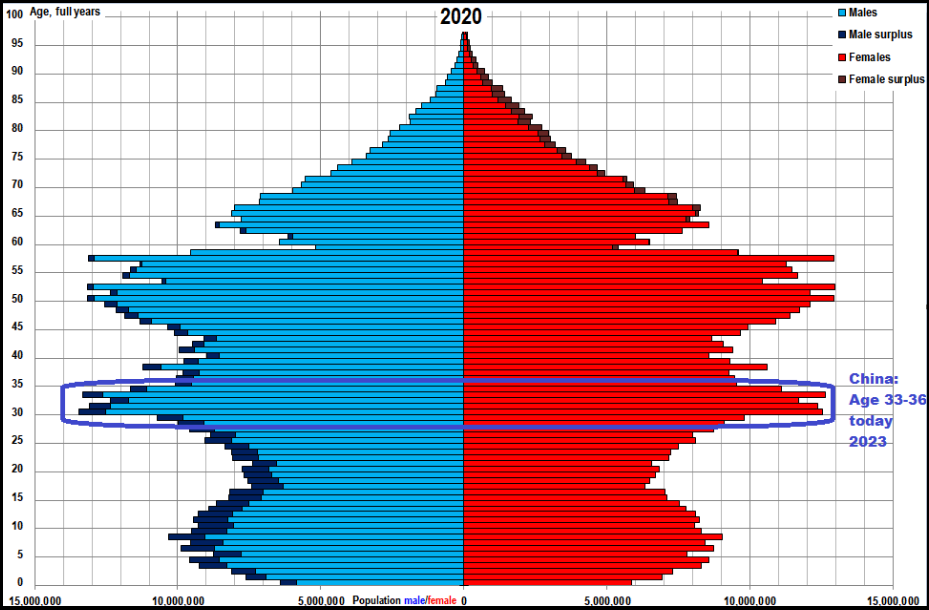
The statement “There is nothing the government can do about demographics, which are unfavorable” is correct 5-10 years out. It could not be more incorrect for the next 3-5 years. Her call is akin to calling the Japan “Top” in 1985. The problem is it (the top) happened in 1989 (preceded by a parabolic 4 year move). I have discussed this quite a few times during this normal bottoming process in Alibaba/China.
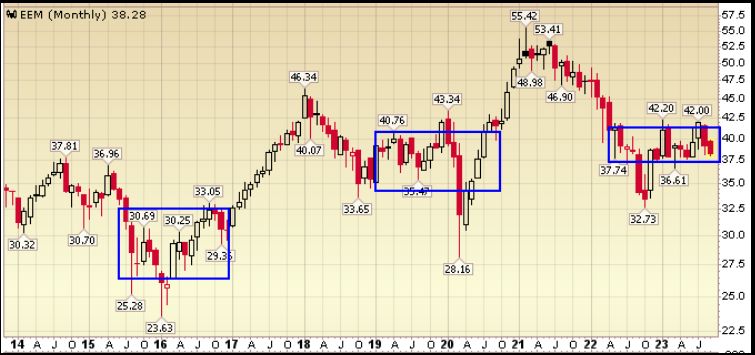
The “neighborhood” is improving slowly but surely. BABA will NOT breakout without the country and emerging markets, but will outperform when the shift occurs. We are in the final washout stage where the impatient are flushed.
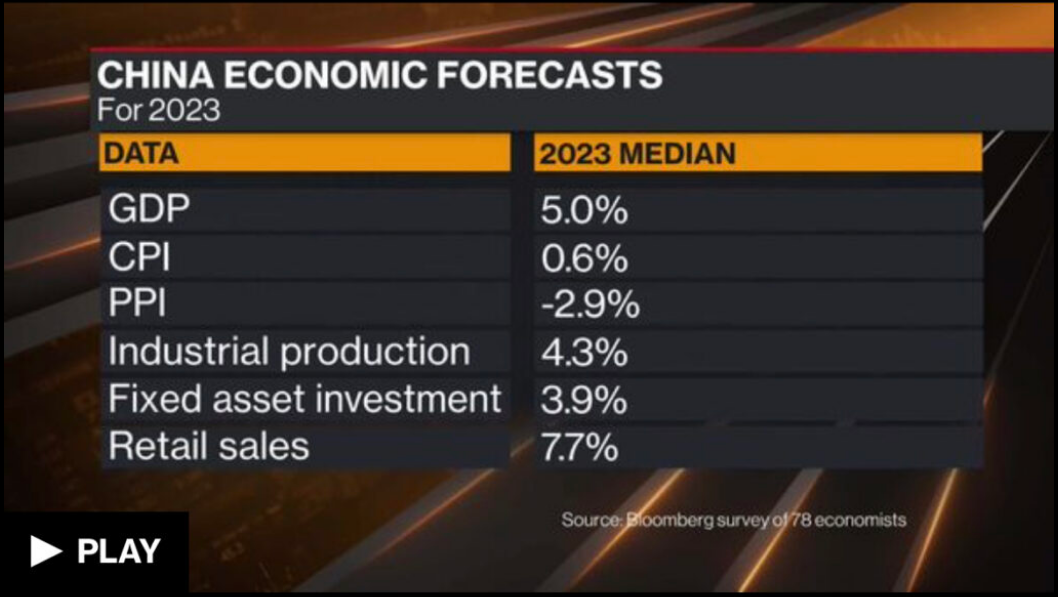
Source: Bloomberg 9-28-2023
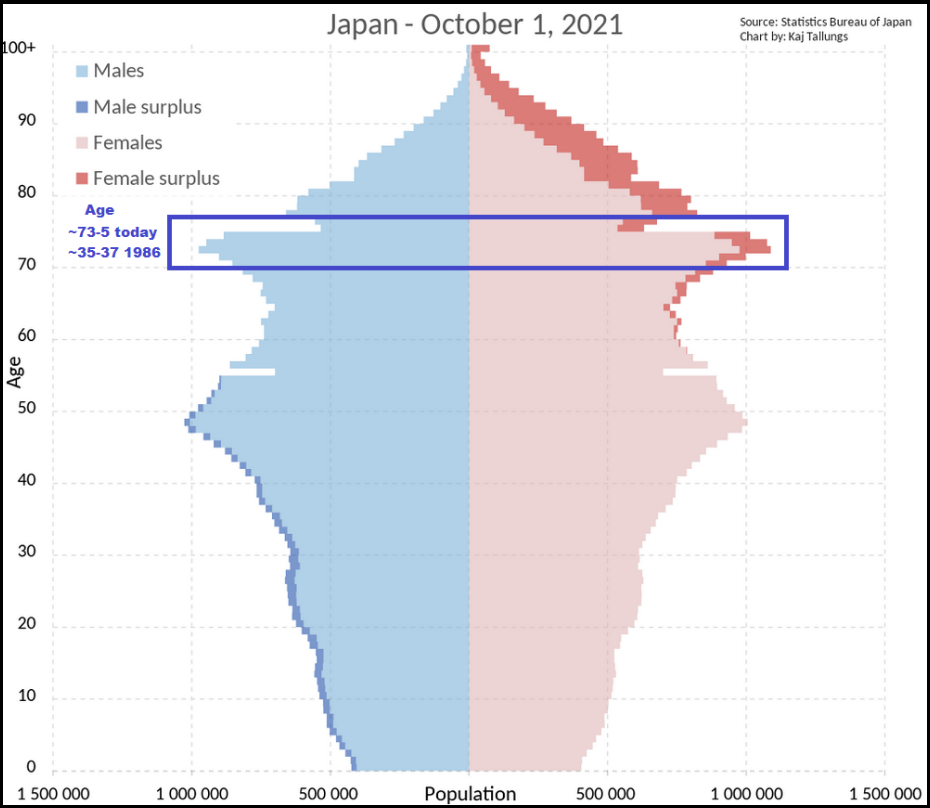
The bulk of the Japanese population was:
Cooper Standard
Someone sent a question for today’s AMA section on the podcast|videocast:
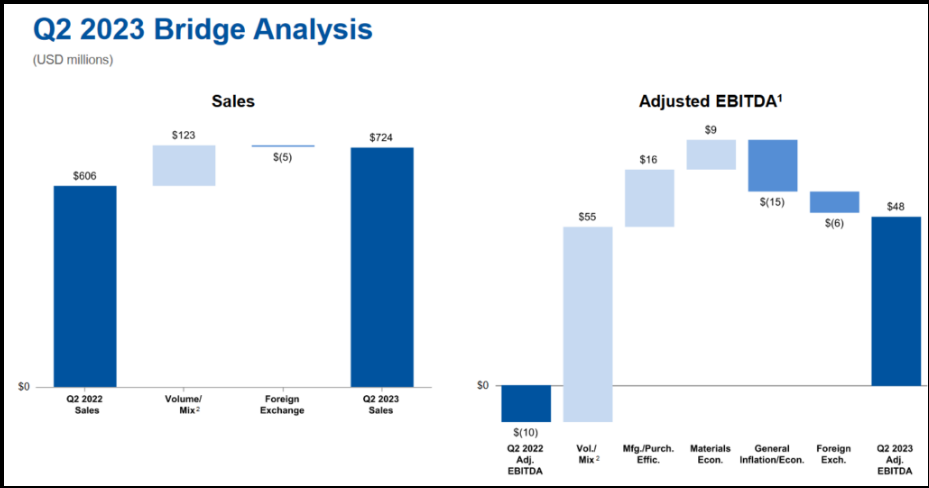
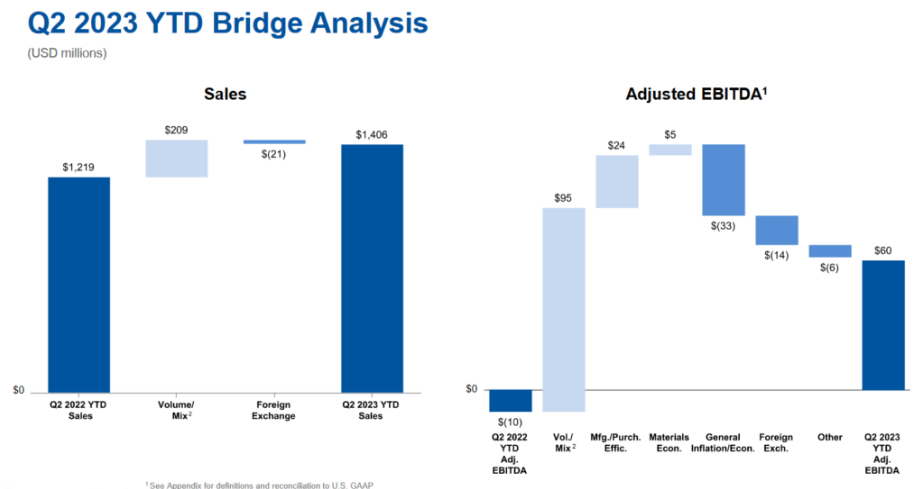
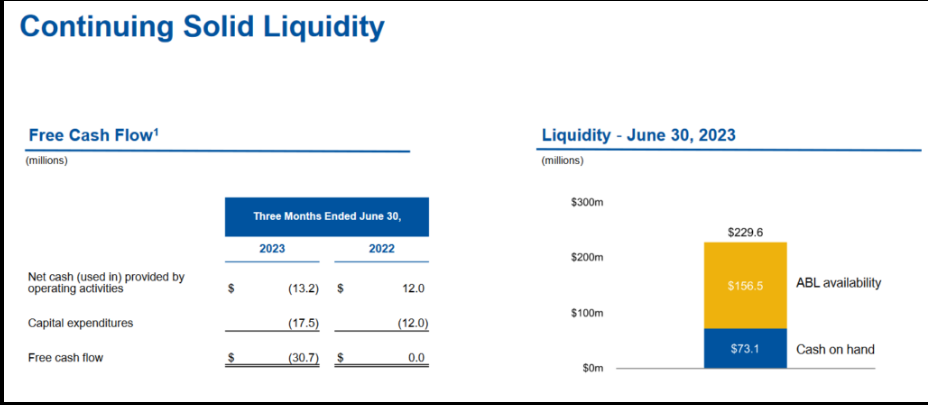
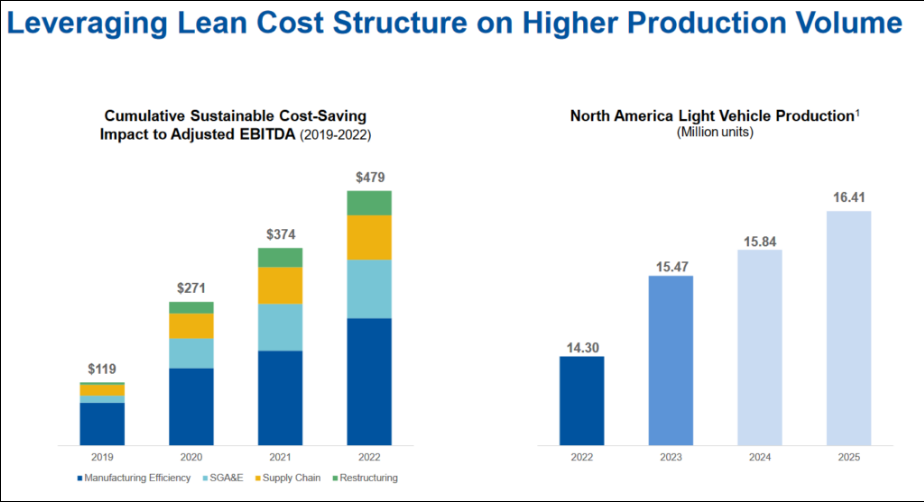
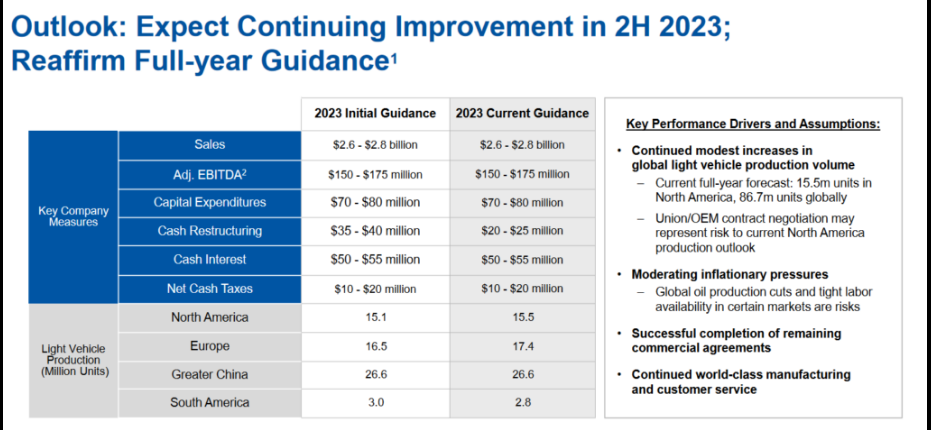
The short answer is it won’t matter as the bulk of the maturities were pushed out (fixed rate) to 2027 during the refinancing. Even the $42M left on 2026 notes allows ample time to refinance and for volumes/operating leverage to kick in. Not to mention – even the most recent hawkish dot plot and projections point to a decline in rates starting in 2024 and more declines in 2025:
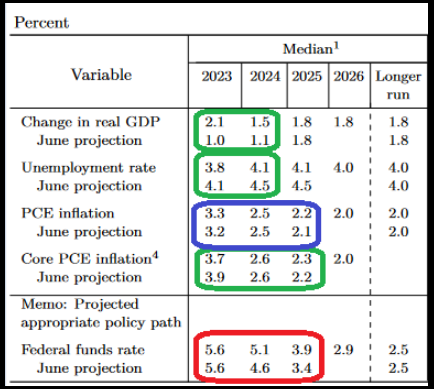
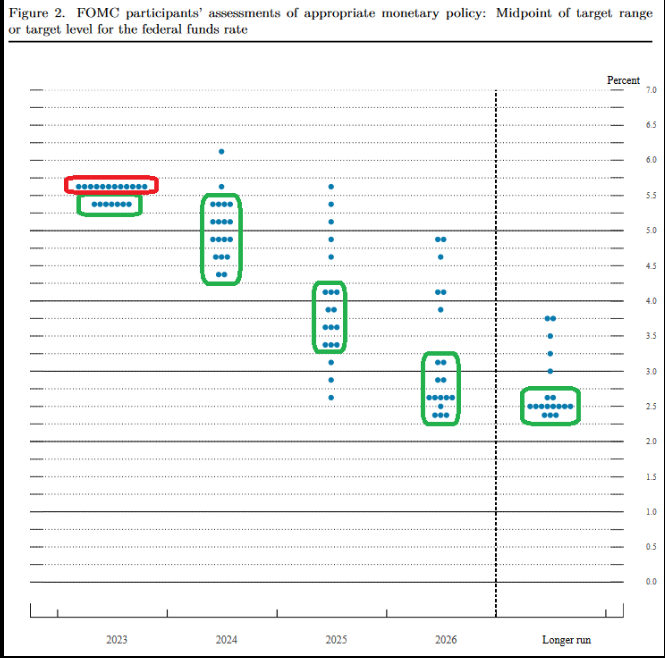
In short, the new debt is fixed. If rates go up, there will be no change. If rates go down, they may take the opportunity to refinance and lower their interest cost.
10-Q Source Document Q2 2023
Generac
Key updates from Investor Day 9-27-2023:
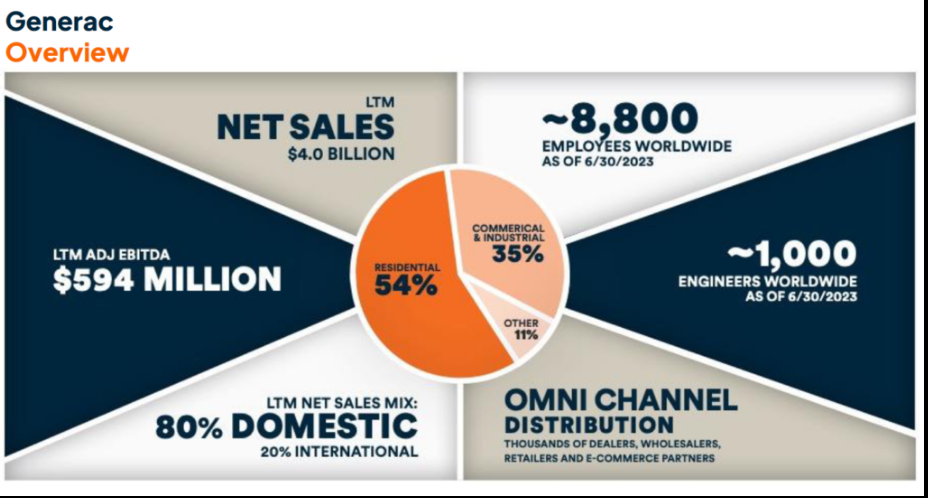
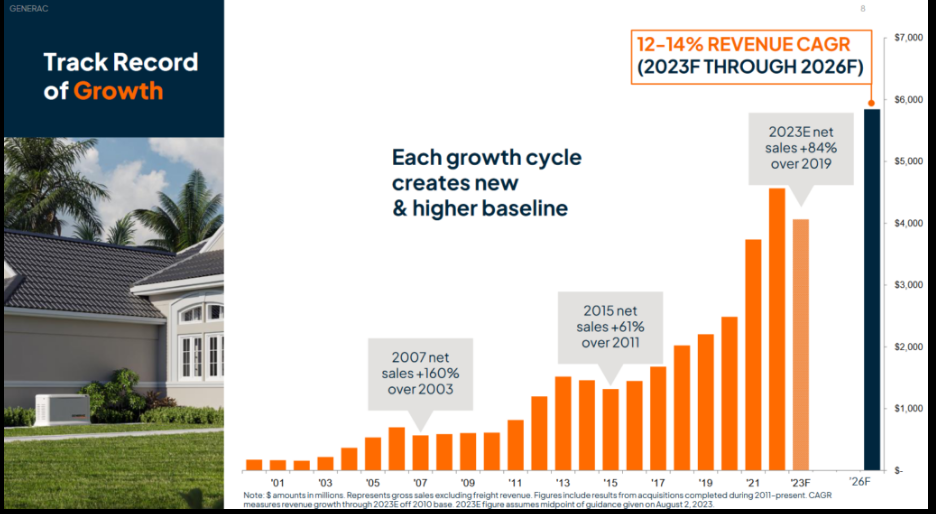
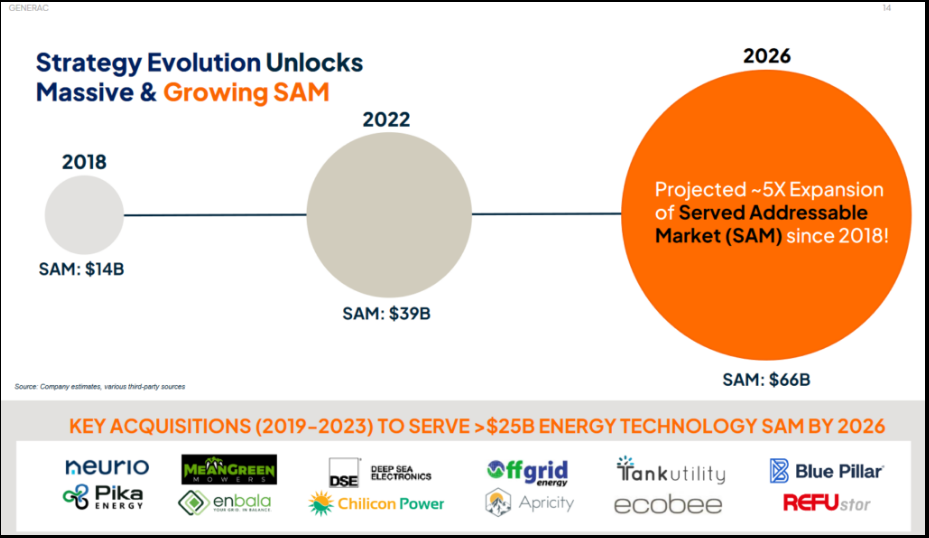
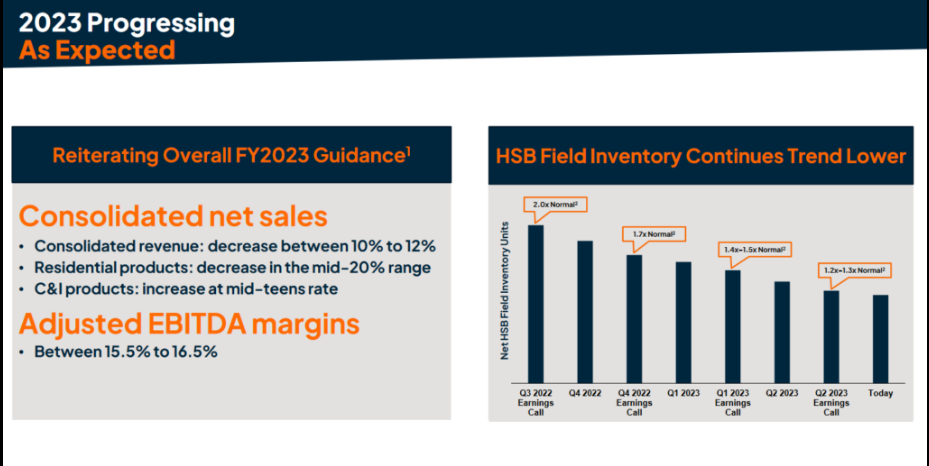
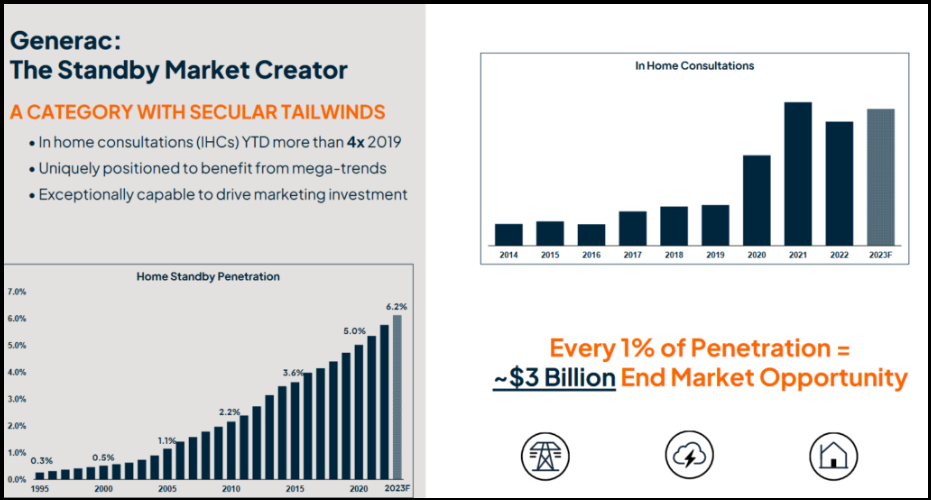
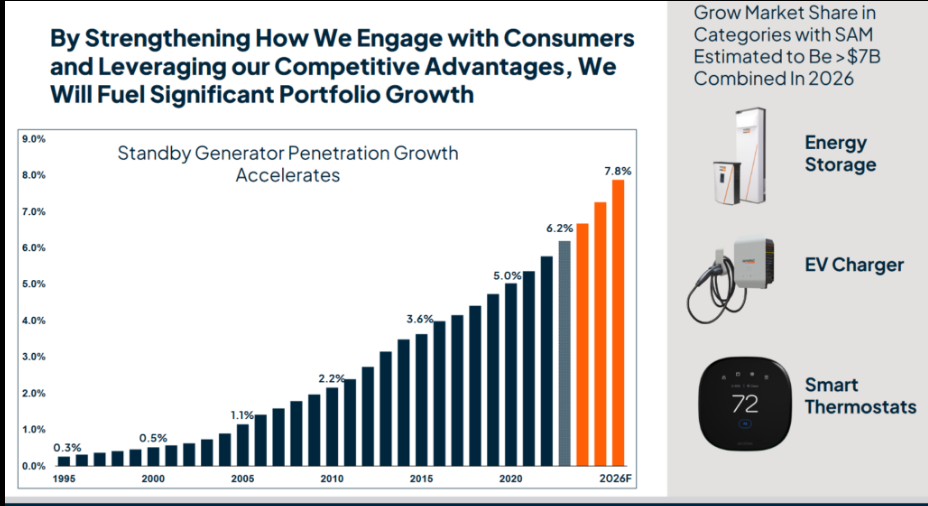
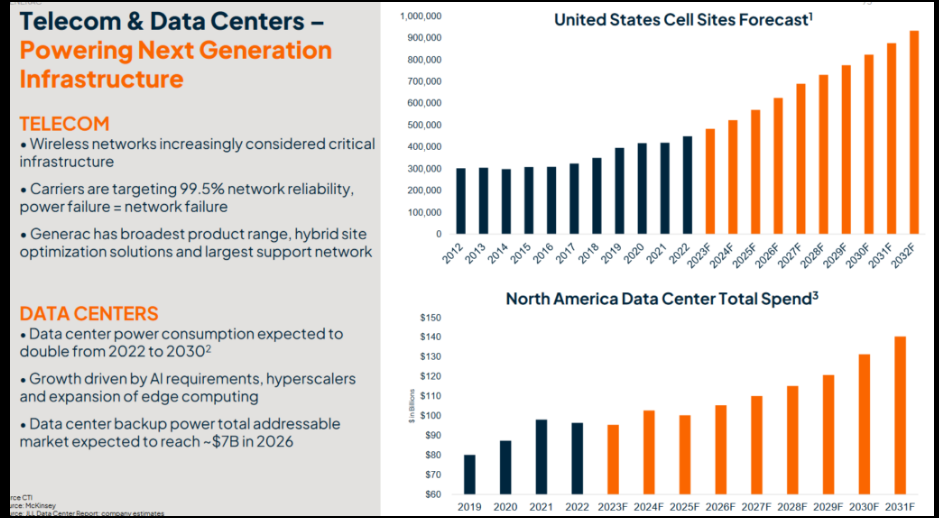
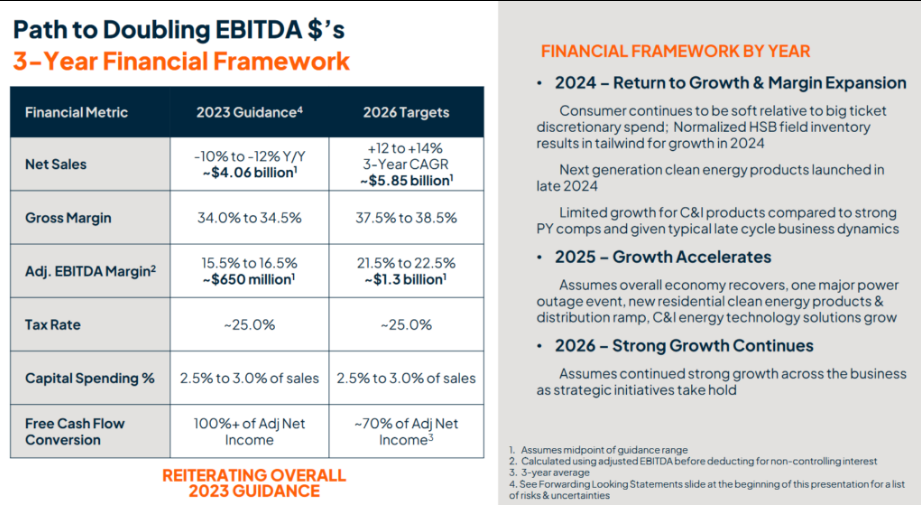
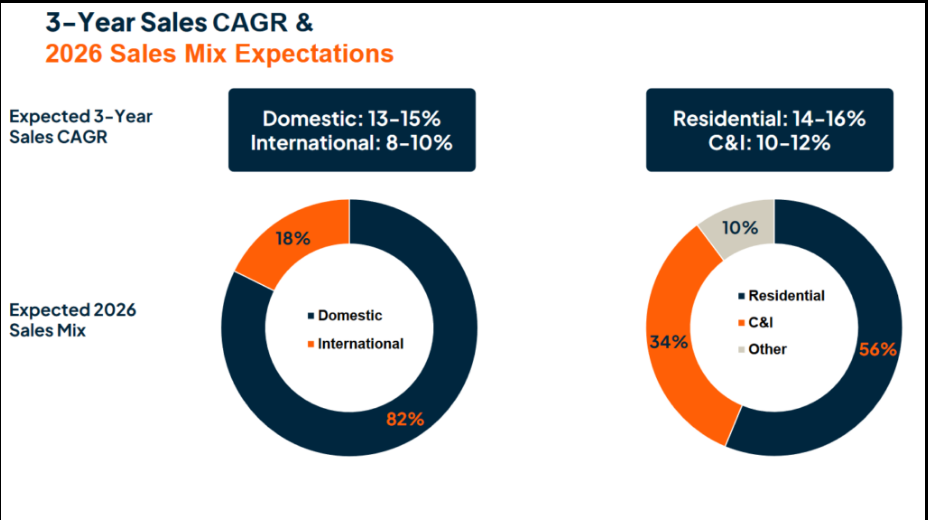
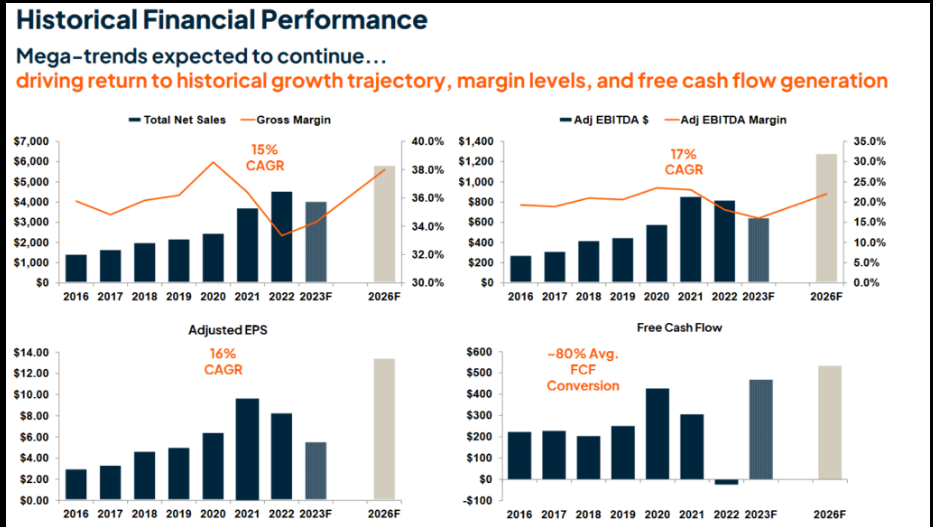
GNRC – Investor Presentation – 9-27-23
History Doesn’t Repeat, It Rhymes
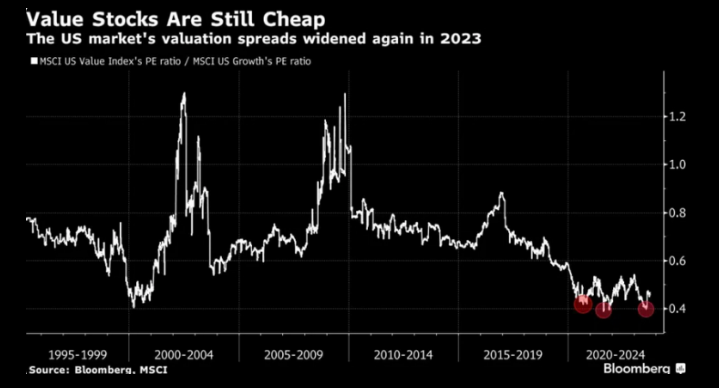
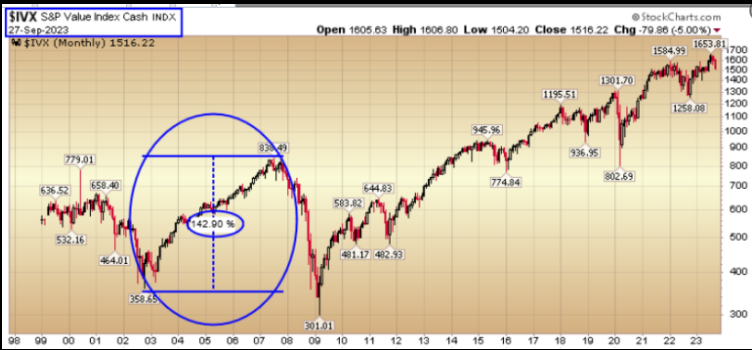
Value multiples haven’t been this stretched to the downside since 2001. Much of our framework is setting up similarly to this period when Emerging Markets/China, Small Caps and Value Stocks dramatically outperformed in ensuing years. It’s always darkest before dawn:
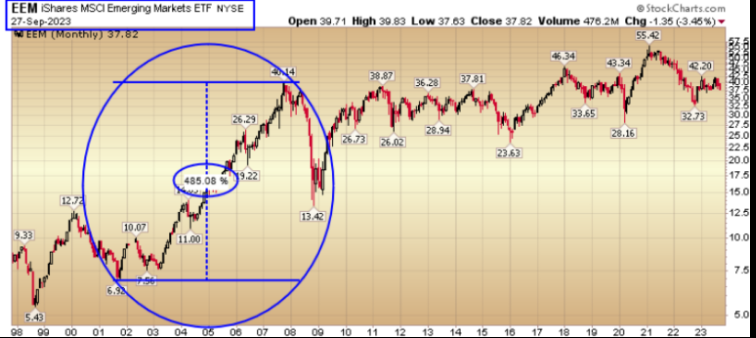
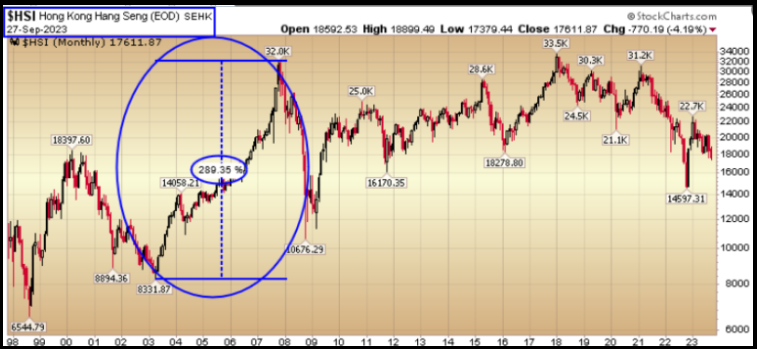
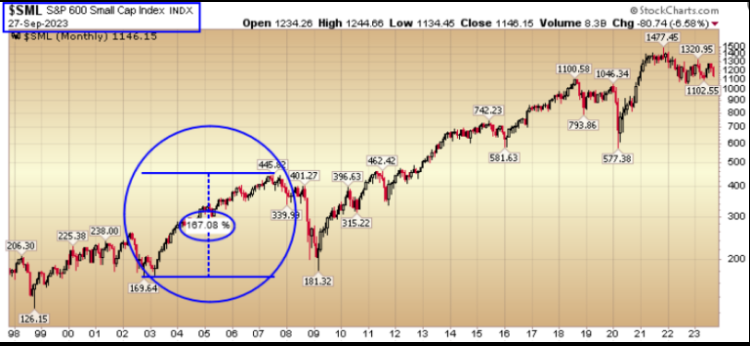
Help is on the Way…
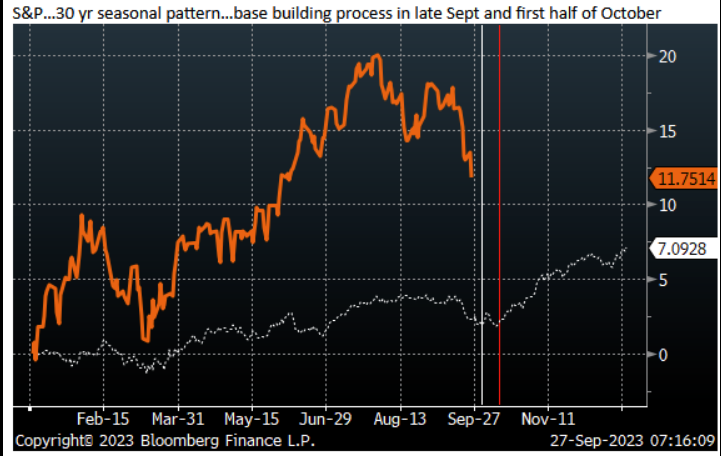
Source: Jeffries
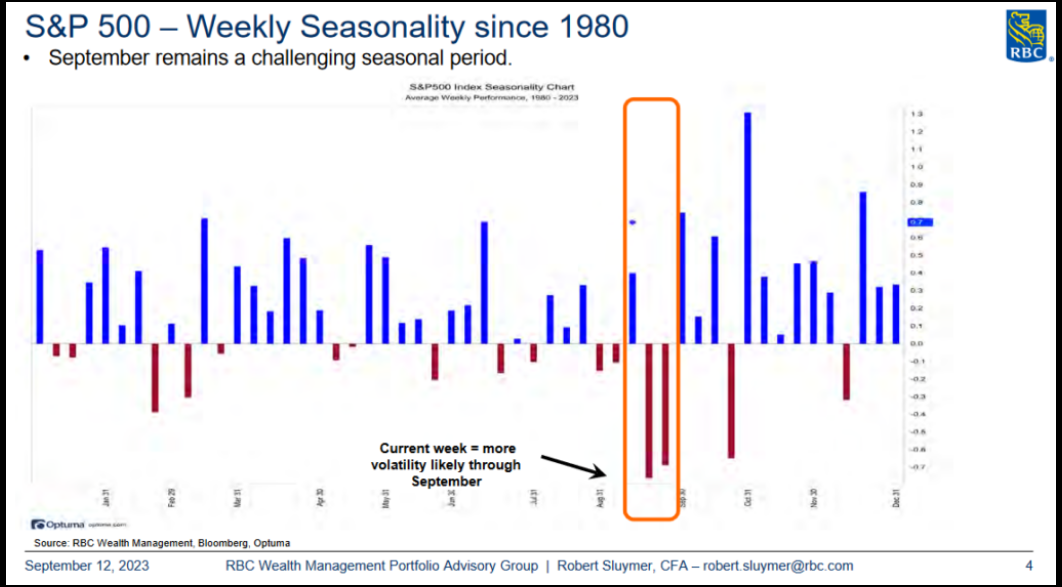
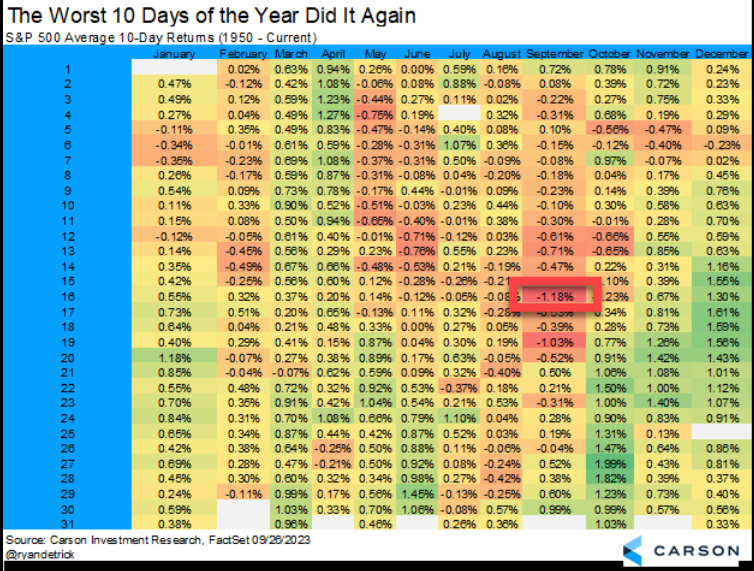
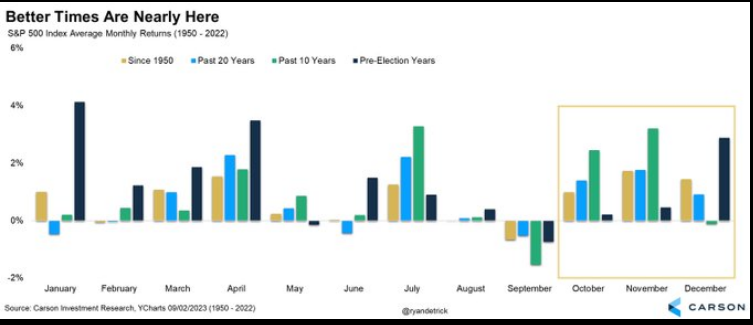
2018-2019 shutdown: Lasted 35 days, S&P 500 gained 9.4%.
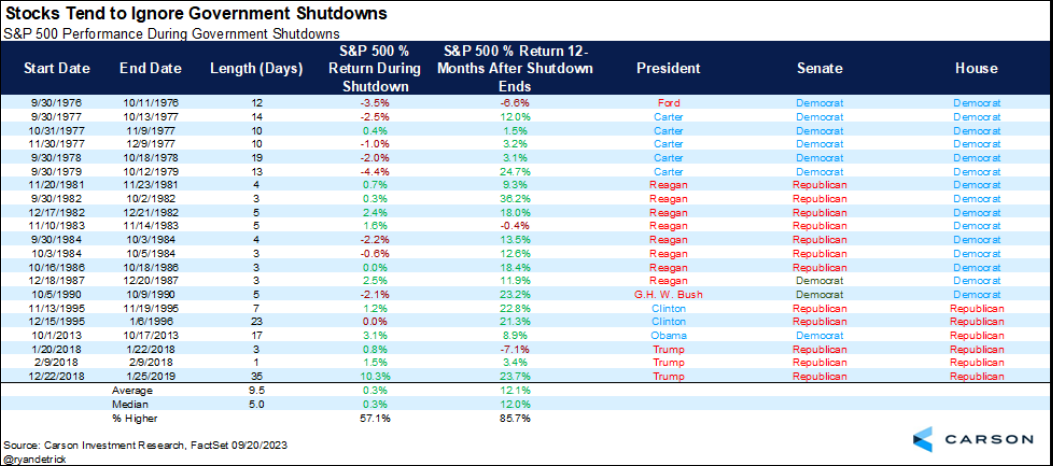
Images Source: Ryan Detrick – Carson Group
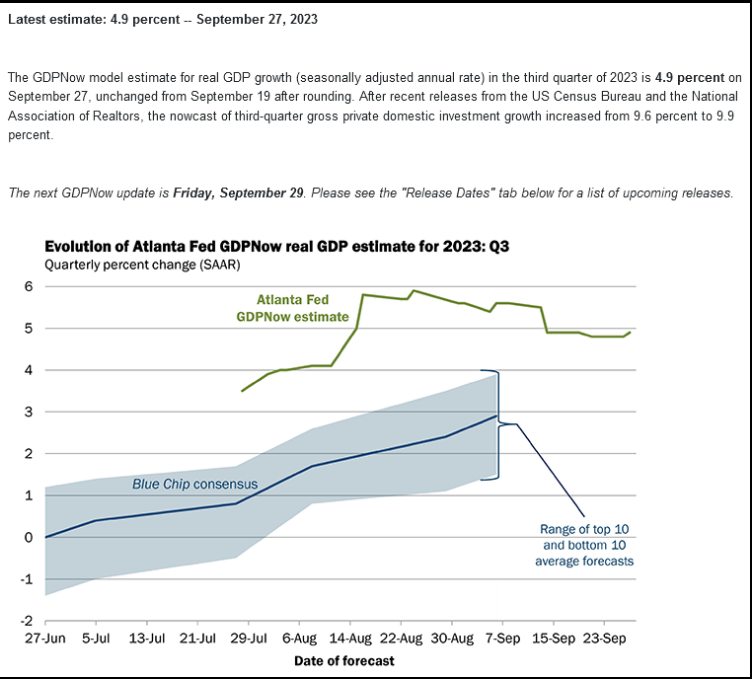
With above-trend economic growth? Hmm…
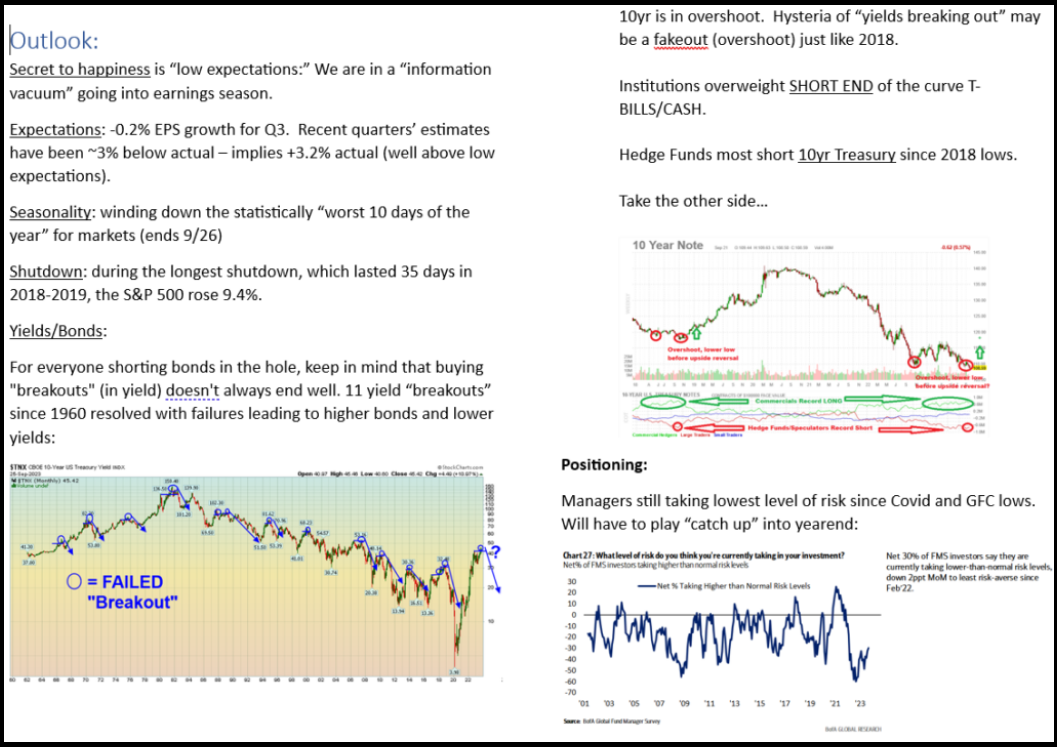
The “Secret to Happiness” is LOW EXPECTATIONS!
Now onto the shorter term view for the General Market:
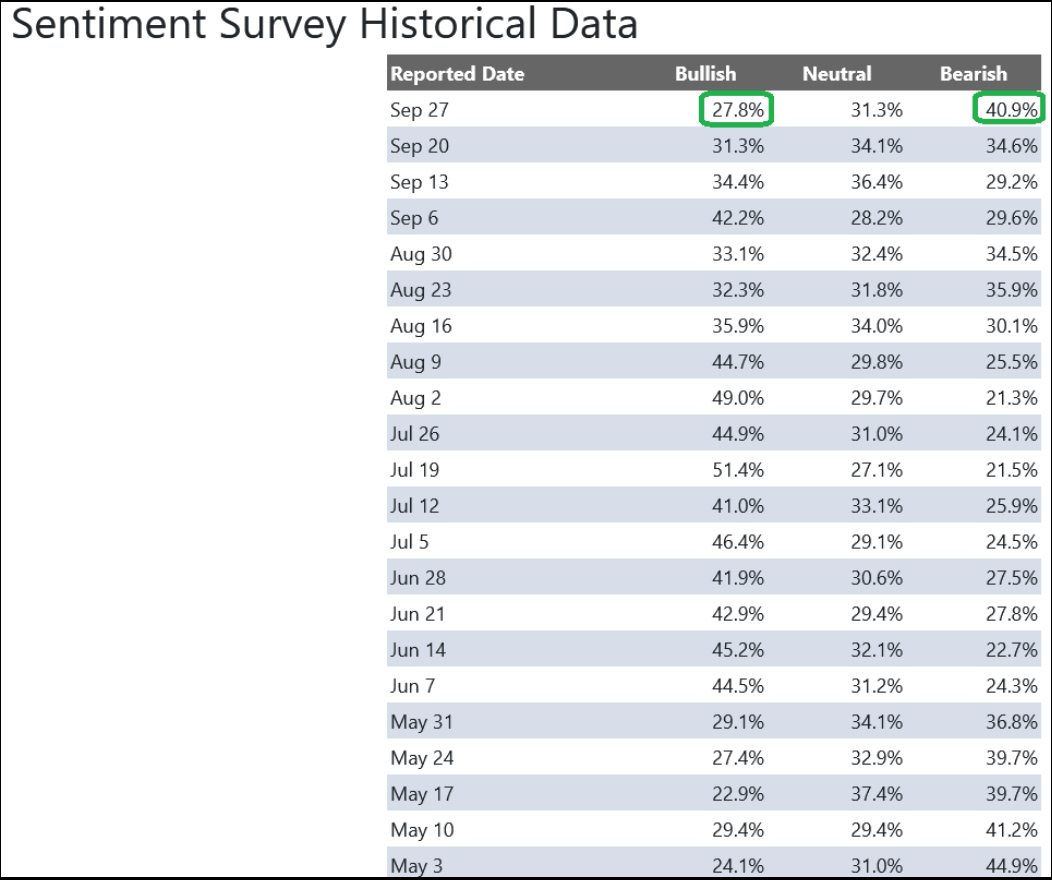
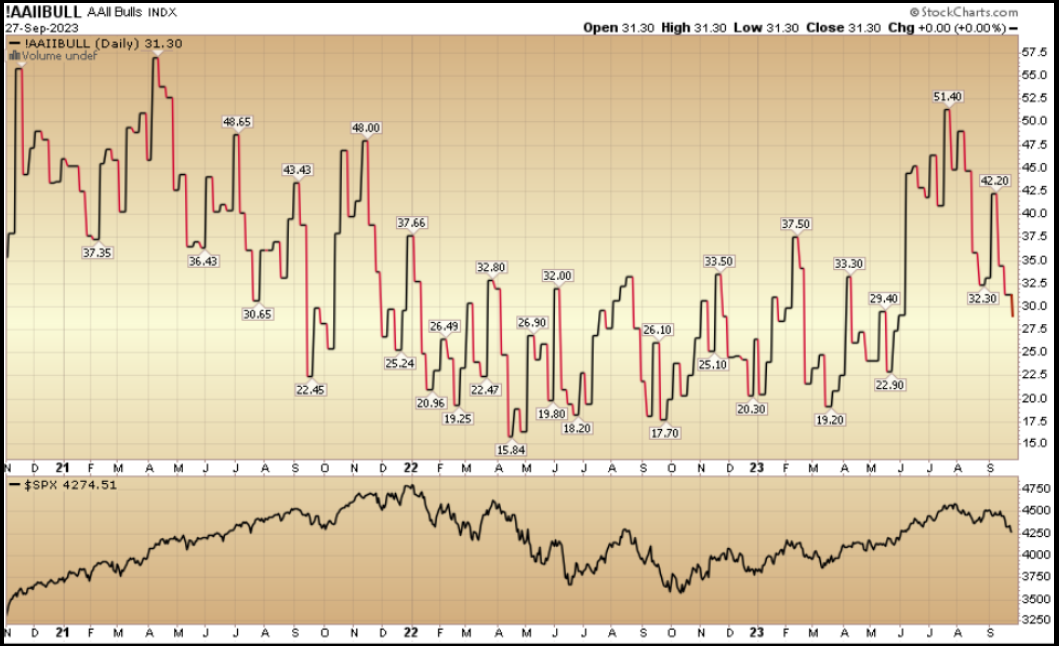
In this week’s AAII Sentiment Survey result, Bullish Percent (Video Explanation) dropped to 27.8% from 31.3% the previous week. Bearish Percent jumped up to 40.9% from 34.6%. Retail investors are fearful again.
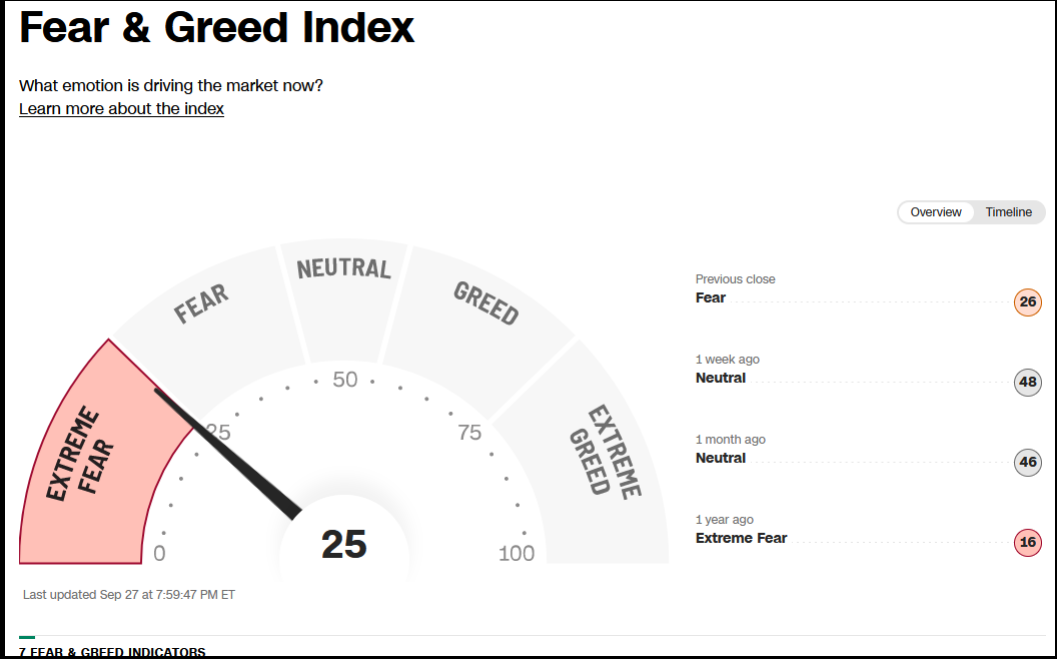
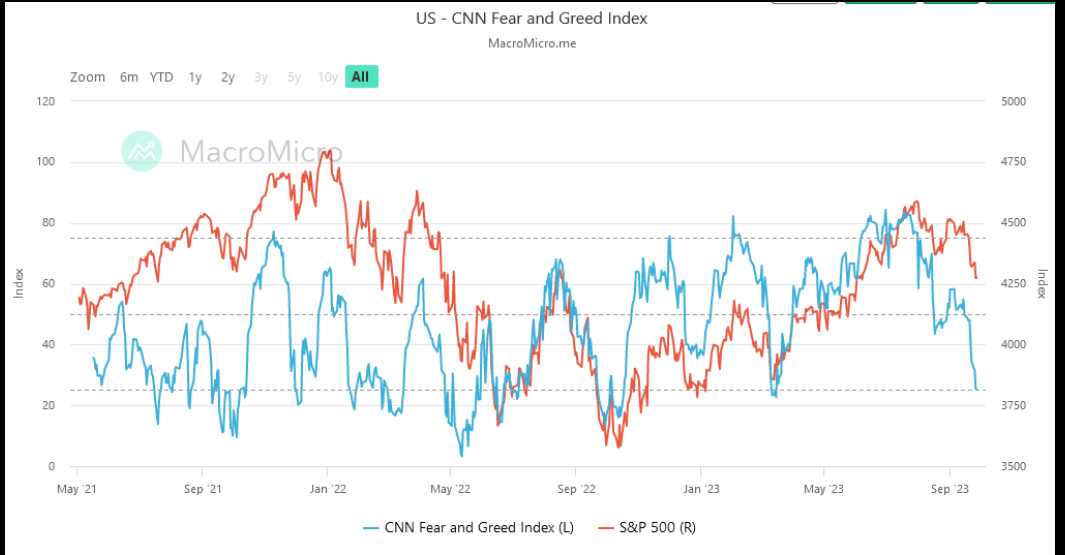
The CNN “Fear and Greed” dropped from 47 last week to 25 this week. Investors are fearful. You can learn how this indicator is calculated and how it works here: (Video Explanation)
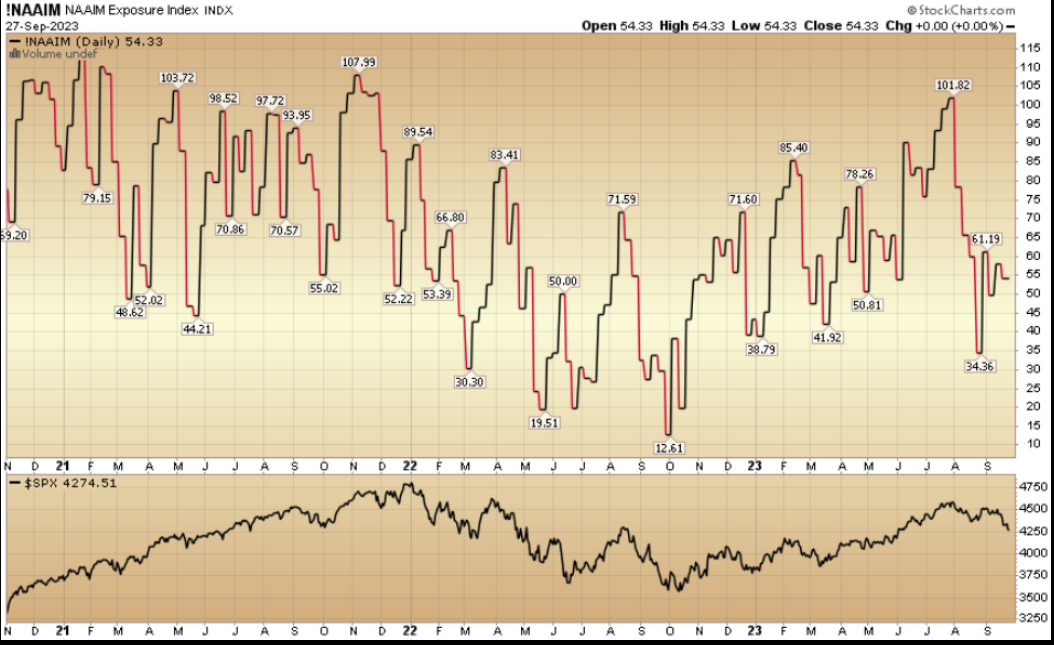
And finally, the NAAIM (National Association of Active Investment Managers Index) (Video Explanation) ticked down to 54.33% this week from 57.98% equity exposure last week. When the tide turns, the “end of year chase” will be on full force.
This content was originally published on Hedgefundtips.com.
Which stock should you buy in your very next trade?
With valuations skyrocketing in 2024, many investors are uneasy putting more money into stocks. Unsure where to invest next? Get access to our proven portfolios and discover high-potential opportunities.
In 2024 alone, ProPicks AI identified 2 stocks that surged over 150%, 4 additional stocks that leaped over 30%, and 3 more that climbed over 25%. That's an impressive track record.
With portfolios tailored for Dow stocks, S&P stocks, Tech stocks, and Mid Cap stocks, you can explore various wealth-building strategies.

