It’s all a matter of perspective. Here in the US, the day ends when the sun sets in the West. At the same time in Japan, a new day is beginning as the sun rises from the East. From an economic and financial perspective, Japan has been a leading indicator for the rest of the world, particularly the large developed industrial economies.
Japan may be leading the way again with a massive fiscal spending program, which may be starting to push bond yields higher over there. Contributing to the upswing in yields is talk that officials of the Bank of Japan (BOJ) are reassessing whether their ultra-easy monetary policies have lost their effectiveness. At the same time, there is some chatter about “helicopter money,” which would mean that the BOJ would directly finance fiscal spending.
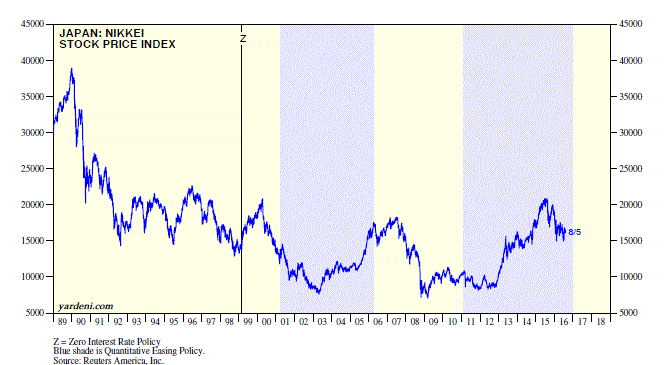
Japan’s Great Recession and great financial crisis occurred in the early 1990s. The country’s real estate and stock market bubbles both burst simultaneously back then. The Nikkei (in yen) plunged 63.2% from a record high of 38915 on December 29, 1989 to a low of 14309 on August 18, 1992. It then traded in a volatile range roughly between 15000 and 20000 through the end of the 1990s before resuming its decline through April 28, 2003, when it fell to 7607. Then it rallied 140.0% through July 9, 2007 and dropped 61.4% through March 10, 2009. It consolidated just north of this level through late 2012, when the introduction of Abenomics sparked a 144.5% rally through June 24, 2015. It is currently down 21.5% from that recent peak, and down 57.8% from the record high in late 1989.
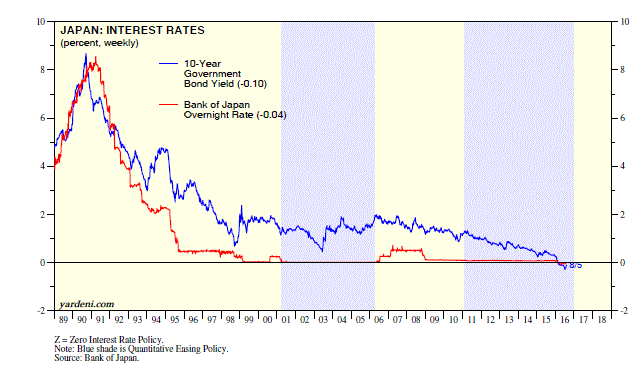
The BOJ led all other central banks by more than a decade with its zero-interest-rate policy (ZIRP), when the official rate was lowered to zero for the first time during March 1999. The BOJ lagged behind the ECB by nearly 20 months, introducing its negative-interest-rate policy (NIRP) on January 29 of this year. The central bank was early with QE (quantitative easing) when it expanded its reserves balances starting during November 2001 through January 2006. That was just a warm-up act for the dramatic expansion of these reserves that started in early 2011, and then went vertical since late 2012.
Yet the Nikkei remains significantly below its record high. There have been numerous fiscal spending programs since the early 1990s that built lots of bridges and roads to nowhere. How do you say in Japanese “If at first you don’t succeed, try, try again”? W.C. Fields added the following to that saying: “Then quit. There’s no point in being a fool about it.” Let’s review what the Japanese are doing now:
(1) Less negative. At the end of July, the BOJ said it would buy ¥6 trillion ($57 billion) worth of exchange-traded stock funds annually, up from ¥3.3 trillion previously. It didn’t change its target for purchasing Japanese government bonds or reduce its main interest rate—already in negative territory. The BOJ’s official rate was lowered to -0.10% on January 29 and kept there at last week’s policy committee meeting.
The central bank has been getting lots of pushback from financial institutions and depositors on its NIRP. As a result, Governor Haruhiko Kuroda may be having second thoughts about going further into negative territory. The 8/2 WSJ reported:
“Japanese government-bond prices have been falling since Friday, when the central bank announced what amounted to modest policy tweaks--dashing expectations of an interest-rate cut further into negative territory and an expansion of asset purchases. The central bank’s easing program has fueled the fantastic run in bond prices since it started three years ago, so any hints the BOJ might be losing its punch has spooked bond investors. Selling accelerated on Tuesday in the run-up to a government auction of 10-year bonds, and continued when results showed that demand remains weak.” (2) Financial stability. The BOJ already owns more than a third of all outstanding Japanese government bonds. There is mounting concern that expanding its bond purchases much further would cause instability in the market.
(3) More of the same. This past week, Japan’s government announced $45 billion in extra spending for the current fiscal year. Prime Minister Shinzo Abe has been seeking to revive economic growth since he took office for a second time during December 2012 with various programs. More spending, totaling $273 billion, is scheduled for the next couple of years.
A 7/31 Bloomberg analysis reports that “this marks the 26th dose of fiscal stimulus since the country’s epic markets crash in 1990.” Bloomberg observes:
“And if previous episodes are any guide, an initial sugar hit to markets and growth will quickly fade amid a realization that extra spending does little to cure the economy’s underlying problems. A Goldman Sachs Inc. study found that markets gave up their gains in the first month after the cabinet approved the stimulus in 18 of the 25 packages it studied since 1990.” Most of the latest program won’t be spending but lending. Some of the headline announcement of new spending actually includes existing spending pledges that have been repackaged. Abe’s decision to introduce a sales tax increase during April 2014 aimed at raising government revenues triggered a recession instead. Plans for another increase have been postponed to 2019.
(4) Structural problems. When Abe announced his program in 2013, it consisted of the “three arrows.” These were fiscal stimulus, monetary easing, and structural reforms. The first two were implemented rapidly, but were offset by the tax hike in 2014. Meanwhile, structural reforms have been slow in coming. Tackling areas like employment regulation has fallen short of expectations.
(5) Poor performance. How do you say in Japanese, “The proof is in the pudding”? Abenomics’ lack of success is evidenced by the government’s try-try-again routine. Japan’s nominal GDP has been essentially flat since the early 1990s. Real GDP has been increased at a subpar pace during the current economic expansion. Despite the massive 24% depreciation of the yen since late 2012, Japanese exports (in yen) are down 10% y/y. Reflecting weak domestic demand, imports (in yen) are down 22% over the past two years.
(6) Bottom line. Japan’s economy continues to stagnate and remains on the edge of deflation. The fear is that the BOJ has run out of NIRP and QE bullets.


