After years of losing out to their passively managed index counterparts during last decade's low-volatility bull market, actively managed ETFs are seeing a resurgence. Investors looking for alternatives after last year's stock and bond bear markets are now flocking to these funds in search of a defensive holding.
Notably, one of JPMorgan (NYSE:JPM)'s derivative income ETFs is seeing increased attention. Over the last month, the JPMorgan Equity Premium Income ETF (JEPI) has seen nearly $1.51 billion in inflows, putting it at the top of the ETF Central Screener rankings for actively managed ETFs.
Investors clearly love this ETF. As of March 23rd, JEPI has swelled to over $24 billion in assets under management, making it the largest actively managed ETF listed on the U.S. market. It's also very popular with yield-chasing investors in the Reddit r/dividends community.
With a 30-day SEC yield of 10.74% and an expense ratio of 0.35%, it's no wonder why retail investors are raving about this ETF. Still, as with all hot investments, I think it's a good idea to peek under the hood before you buy. Let's take a deep dive into JEPI and see what makes this ETF tick.
JEPI holdings & strategy explained
JEPI combines a long equity position with a short call position. In other words, it’s a covered call ETF. However, JEPI differs from the usual index-linked covered call ETFs we've looked at previously in more than a few ways, making it a rather unique ETF in the derivative income category.
Firstly, JEPI's equity holdings are actively selected and managed. Unlike say, the Global X S&P 500 Covered Call ETF (XYLD), JEPI does not track or hold all the stocks in a benchmark index. As the ETFs summary prospectus states, it is actively managed.
At any time, JEPI will invest at least 80% of its capital in stocks mostly selected from the S&P 500 index but can also venture outside the S&P 500 for stock selection. JEPI's current security selection process is a bit of a proprietary black box. The ETF doesn't specify which metrics it screens for.
Rather, JEPI's fund management team selects "securities that are identified as attractive and considers selling them when they appear less attractive", which is as active management as it gets. According to the summary prospectus, the fund manager considers factors such as:
- Catalysts, such as improving company fundamentals, that could trigger a rise in a stock’s price.
- Impact on the overall risk of the portfolio.
- High perceived potential reward compared to perceived potential risk.
- Possible temporary mispricing caused by market overreactions.
JEPI also employs a proprietary valuation model to rank its securities, with the goal of producing a portfolio that has lower volatility than the S&P 500.
Finally, the remaining 20% of JEPI’s capital is invested in exchange-linked notes (ELNs) issued by counterparties which provide synthetic exposure to covered call options on the S&P 500 index. Because JEPI does not own all the stocks in the S&P 500 index, it cannot sell covered calls, hence the use of ELNs.
Two of the risks worth mentioning here are strategy risk and counterparty risk. First, as with all actively managed ETFs, there is no assurance that the team will succeed with their strategy, or that the strategy will remain consistent over long periods of time (style drift).
Second, because the ELNs are debt instruments, they are subject to credit, counterparty, and liquidity risks. That is, if the financial condition of JEPI’s counterparties deteriorates significantly, they may fail to make payments when due or default completely.
JEPI historical performance
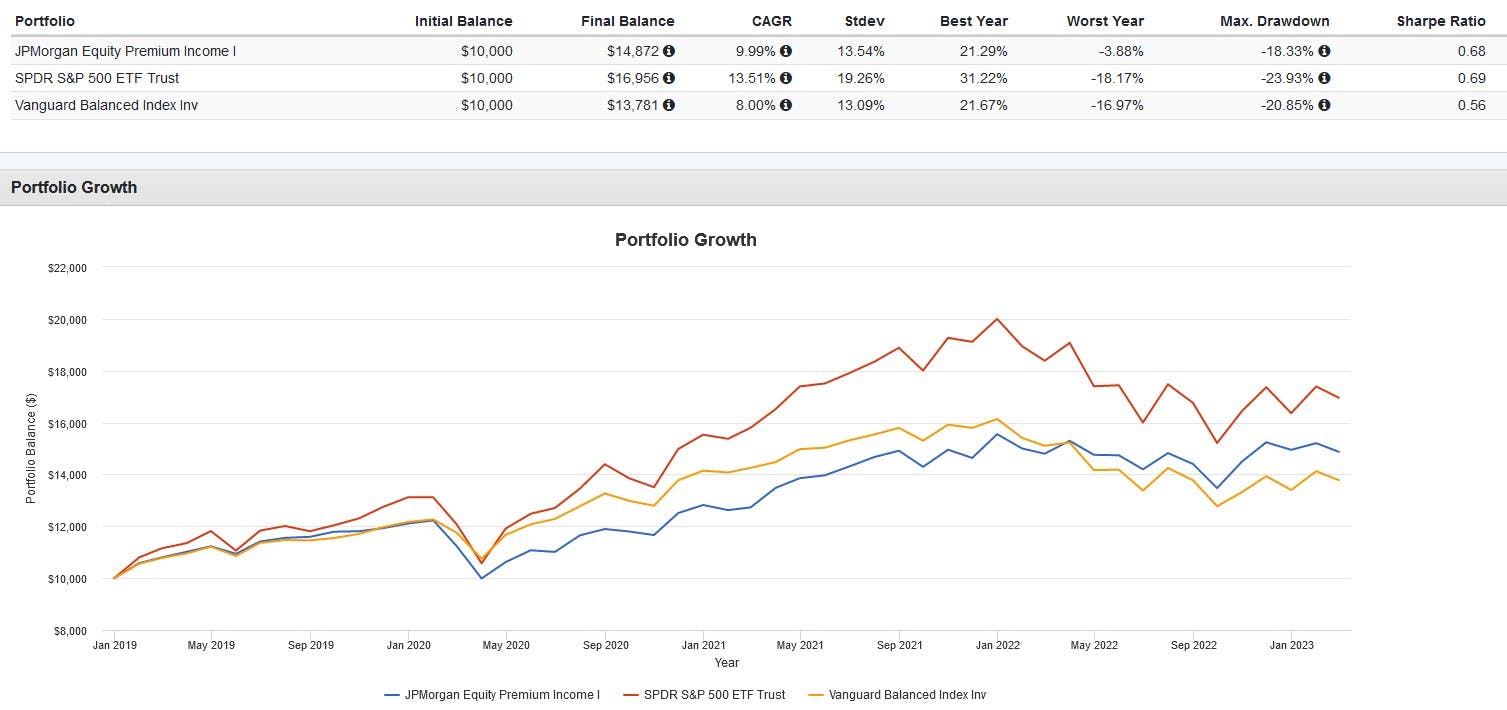
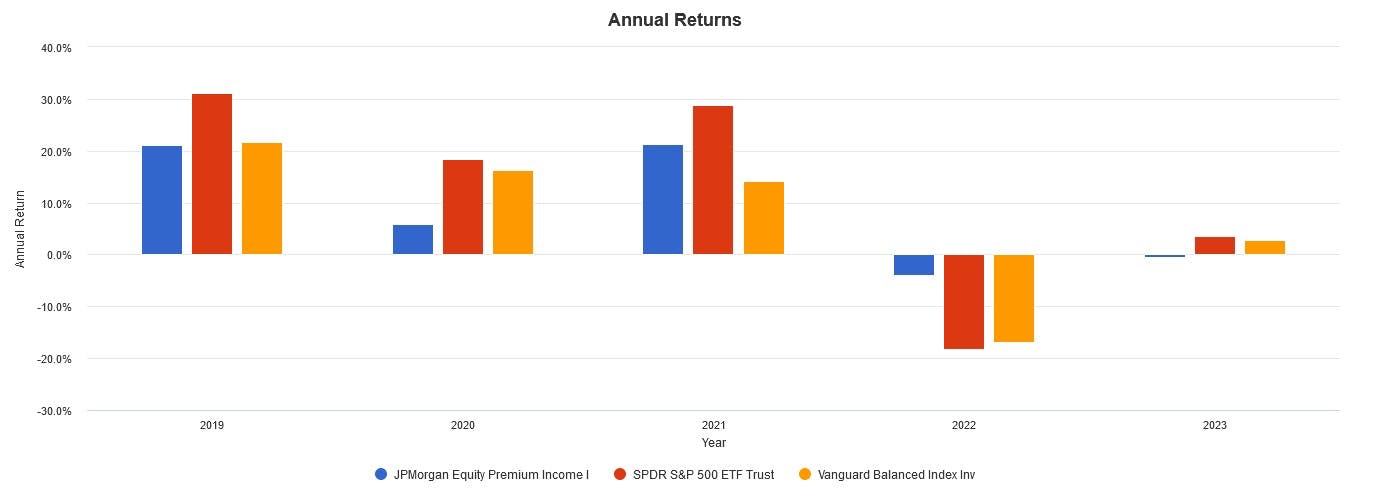
How has JEPI performed historically? I conducted a backtest of JEPI's mutual fund equivalent, the JPMorgan Equity Premium Income I (JEPIX), which has a higher expense ratio of 0.60% but is otherwise identical, versus both the S&P 500 and a balanced 60/40 portfolio of U.S. stocks and bonds to find out.

During this time, JEPIX (aka JEPI) underperformed the S&P 500 on a total return basis but matched it in terms of risk-adjusted returns. Notably, it beat the 60/40 portfolio in terms of both, and displayed similar volatility and lower drawdowns. JEPI also crushed it during the rising interest rate environment of 2022.

That being said, JEPI fell much harder than the 60/40 portfolio during the March 2020 COVID-19 crash as the covered call overlay from its ELNs wasn't able to provide much of a hedge, while also capping its gains during the V-shaped rebound of April.

Here's my opinion: for income investors conscious about rising interest rates and who don't mind paying extra for active management, JEPI could be an excellent substitute for a portion or all of a portfolio's equity allocation but isn't a complete substitute for high-quality fixed-income like Treasurys.
This content was originally published by our partners at ETF Central.
