When it comes to bonds, the average Canadian investor usually opts for something like the BMO (TSX:BMO) Aggregate Bond Index ETF (ZAG), which holds a diversified combination of government and investment-grade corporate issues, charges low fees, and has high assets under management (AUM).
However, investing in high-yield junk bonds, also known as non-investment grade bonds, can offer the potential for higher returns compared to investment-grade bonds. This is because junk bonds are issued by companies with lower credit ratings (lower than BBB), and therefore carry a higher risk of default.
As a result, these companies must offer higher yields to entice investors to purchase their bonds. However, along with the potential for higher returns comes increased risk. Junk bonds are more susceptible to default and can result in substantial losses for investors.
Additionally, they can be more sensitive to changes in the economy and market conditions, as well as to the financial health of the issuing company. In times of economic uncertainty or financial turmoil, the prices of junk bonds can experience significant declines.
With bond yields starting 2023 in a much higher position, more and more investors are looking at high-yield bonds. Investors burned by rising interest rates in 2022 can now squeeze out more returns by moving down in credit quality instead of up in duration. Let's take a look at this asset class closely.
High-yield bond historical performance
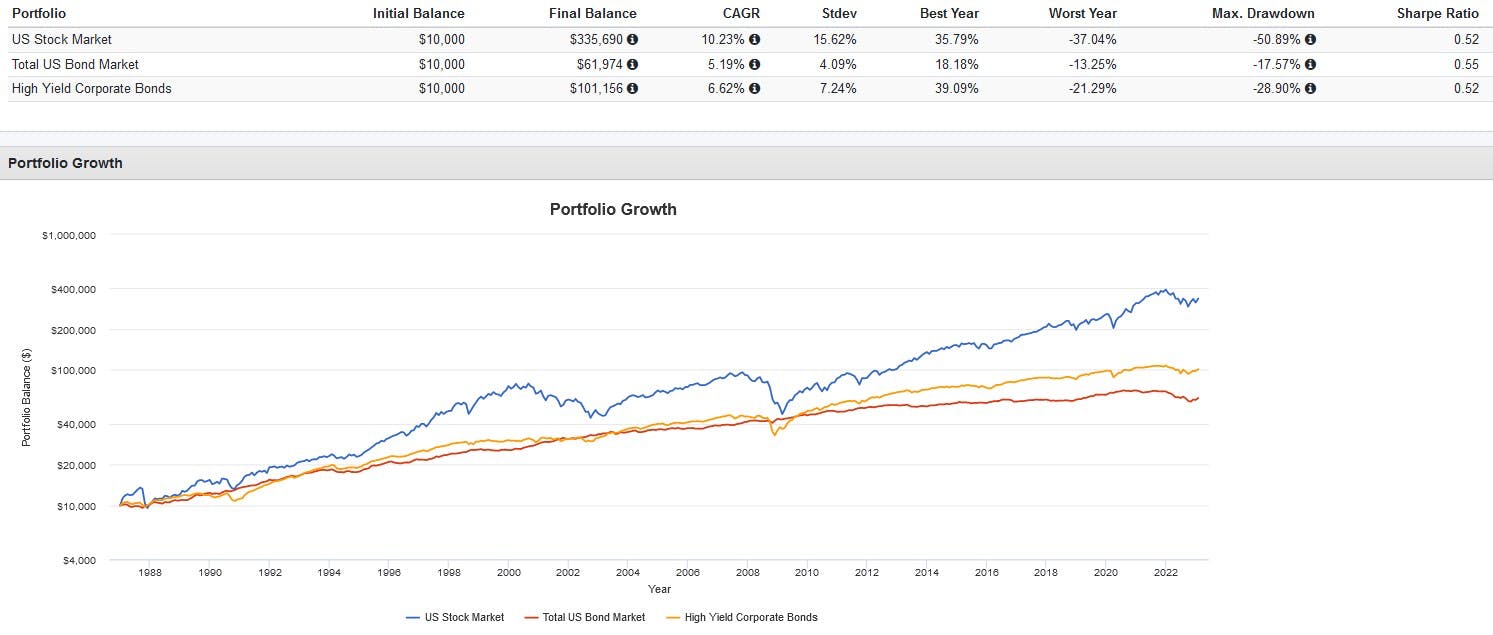
In terms of risk and return, high-yield bonds sit between aggregate bonds and stocks. A backtest from 1987 to the present shows the following results:


We see that although high-yield bonds had higher trailing and rolling returns compared to aggregate bonds, they also incurred higher volatility and drawdowns, with a slightly poorer overall risk-return ratio. However, while their returns fell short of equities, they also incurred far less risk.
The higher correlations of high-yield bonds to equities can also be seen here. While aggregate U.S. bonds had a low 0.13 correlation with U.S. equities, high-yield bonds had a 0.66 correlation. Practically, this means that when the markets take a dive, there is a greater chance of high-yield bonds following suit.

Case in point, we can see that high-yield bonds have suffered much deeper drawdowns during various historical market stress periods compared to aggregate bonds, but still less than stocks overall.

High-yield bond ETFs in Canada
The Canadian high-yield bond ETF space is rather limited. My theory is that this asset class is not viewed by the majority of Canadian investors as a "go-to" option when it comes to seeking higher income. For that purpose, Canadian investors generally default to dividend, REIT, and covered call ETFs.
Still, there are some options on the market. The most popular one right now is the NBI High Yield Bond ETF (TSX:NHYB) (NHYB), which currently sports just over $1 billion in AUM. Unlike most bond ETFs, NHYB is actively managed and charges a higher 0.69% expense ratio.
As of December 31st, 2022, 98.60% of NHYB's holdings are from U.S. issuers, with 48.11% having a BB credit rating and 36.86% having a B credit rating. The ETF has a relatively low average duration of 3.92 years while sporting a high gross yield to maturity of 8.26%.
Other options include the BMO High Yield Us Corporate Bond (TSX:ZJK) (ZJK) and the BMO High Yield US Corporate Bond ETF (CAD Hedged) (TSX:ZHY) (ZHY). The former is non-currency hedged, while the latter is currency hedged (this article explains the difference). Both ZJK and ZHY have over $900 million in AUM.
Unlike NHYB, both ZJK and ZHY are passively managed, tracking the Bloomberg Capital U.S. High Yield Very Liquid Index. As with NHYB, the holdings of both ETFs are concentrated in U.S. bonds with most rated BB and B. In terms of portfolio metrics, ZJK and ZHY both have low average durations of 3.77 years along with a high yield-to-maturity of 8.01%.
This content was originally published by our partners at the Canadian ETF Marketplace.
Which stock should you buy in your very next trade?
With valuations skyrocketing in 2024, many investors are uneasy putting more money into stocks. Unsure where to invest next? Get access to our proven portfolios and discover high-potential opportunities.
In 2024 alone, ProPicks AI identified 2 stocks that surged over 150%, 4 additional stocks that leaped over 30%, and 3 more that climbed over 25%. That's an impressive track record.
With portfolios tailored for Dow stocks, S&P stocks, Tech stocks, and Mid Cap stocks, you can explore various wealth-building strategies.
