Fed to hold rates next week, but eyes on Jackson Hole for policy pivot clues: BofA
Mitigating downside risk isn't a task solely reserved for options or fixed-income securities. Beyond these traditional safe havens, a strategic approach that's been gaining traction involves harnessing the power of stock screeners to cherry-pick equities with defensive traits.
The goal? To weave together a portfolio where the collective risk is dampened, allowing investors to weather market storms with a bit more peace of mind.
However, herein lies a common pitfall: at a cursory glance, many investors conflate "low volatility" with "minimum volatility" strategies, often employing them interchangeably.
This oversight can be attributed to a lack of clarity on how these strategies fundamentally differ in terms of their construction and objectives. The truth is, they operate based on distinct rule sets, and recognizing this distinction is paramount to harnessing their full potential.
Let's contrast two widely recognized ETFs as a case study: the Invesco S&P 500 Low Volatility ETF (SPLV) and the iShares Edge MSCI Min Vol USA ETF (USMV).
SPLV Breakdown
The underlying premise of the SPLV is fairly simple: the ETF employs a screener that selects 100 securities from the S&P 500 index that have exhibited the lowest realized volatility over the previous 12 months. But what do we mean by "volatility"?
In essence, volatility measures how drastically a security's price can change within a certain timeframe. It's gauged using a statistical tool called the standard deviation, which in layman's terms, quantifies the extent of a security's price fluctuations. Think of it as a yardstick for a stock's unpredictability.
Diving deeper into the composition of SPLV's portfolio, one notices a marked departure from the broader S&P 500. A substantial portion, approximately 26%, is parked in consumer staples, followed by a 19% allocation to utilities, and 15% dedicated to healthcare.
These sectors are often termed as "defensive," as they tend to be less sensitive to economic cycles, offering stable earnings and dividends. In times of market uncertainty, they often act as shields, providing relative stability in a turbulent investment landscape.
USMV Breakdown
At its core, while SPLV is laser-focused on the individual historical standard deviation of each stock, with the objective of pinpointing the 100 with the lowest volatility over the past year, USMV adopts a more panoramic stance.
Utilizing an optimization-based strategy, USMV aims to construct a portfolio that, in its entirety, exhibits the least amount of volatility. Put simply, it's like cooking a meal. Instead of just selecting the mildest individual ingredients, USMV is concerned about how all the ingredients mix together to deliver a well-balanced dish.
This means that USMV might accommodate some stocks that are quite volatile when viewed in isolation. However, when these stocks are married with others within the portfolio, the result is a synergistic blend that dampens overall volatility.
The secret sauce here isn't alchemy; it's a matter of correlation, or more precisely, the absence or reduction of it. Stocks that move differently or even in opposite directions can offset each other's price swings, making the combined portfolio more stable.
By taking this broader, portfolio-level perspective, USMV boasts a sector composition that closely mirrors the S&P 500. The portfolio is more evenly distributed across its 170 stocks, with information technology, health care, and financials taking the lead, representing 23%, 19%, and 13% respectively.
Comparison of USMV and SPLV
The allure of reduced market volatility is enticing, and both USMV and SPLV present strategies aiming to offer investors a smoother journey. However, like most investment strategies, neither is without its drawbacks.
Starting with USMV, while its optimization-based approach is intellectually compelling, it rests upon the delicate fulcrum of correlations. The model presumes that historical correlations between stocks will persist, a belief that can be treacherous.
There's a Wall Street adage that reminds us: "In times of crisis, all correlations tend to go to 1." This essentially means that during extreme market upheavals, assets that once moved independently might suddenly move in tandem, jeopardizing the entire premise of USMV.
SPLV, for its part, has its Achilles heel rooted in its methodology. By relying on a screener that's backward-looking, focusing solely on historical standard deviation, it's inherently limited. The past, as the disclaimer goes, is not always indicative of future performance. Such an approach can miss out on how a stock might react when confronted with unprecedented challenges.
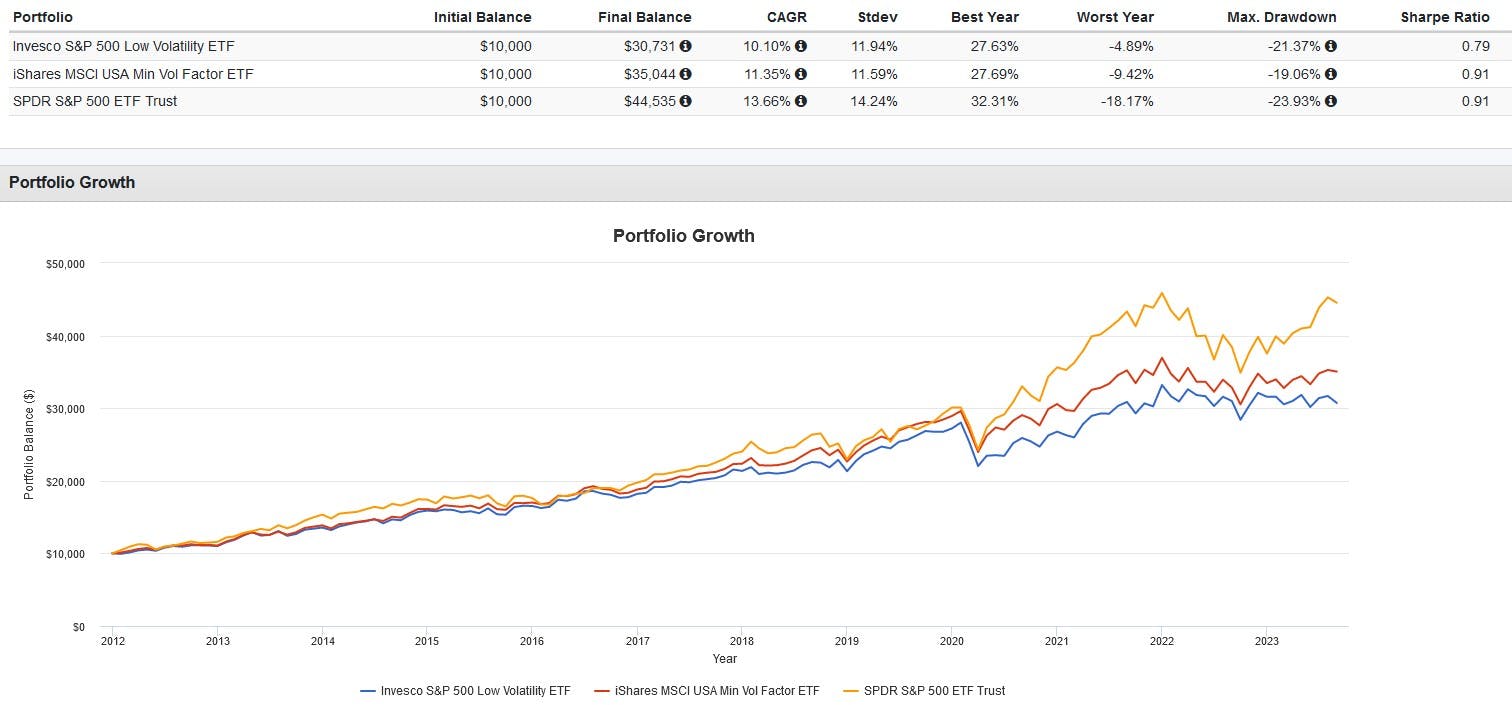
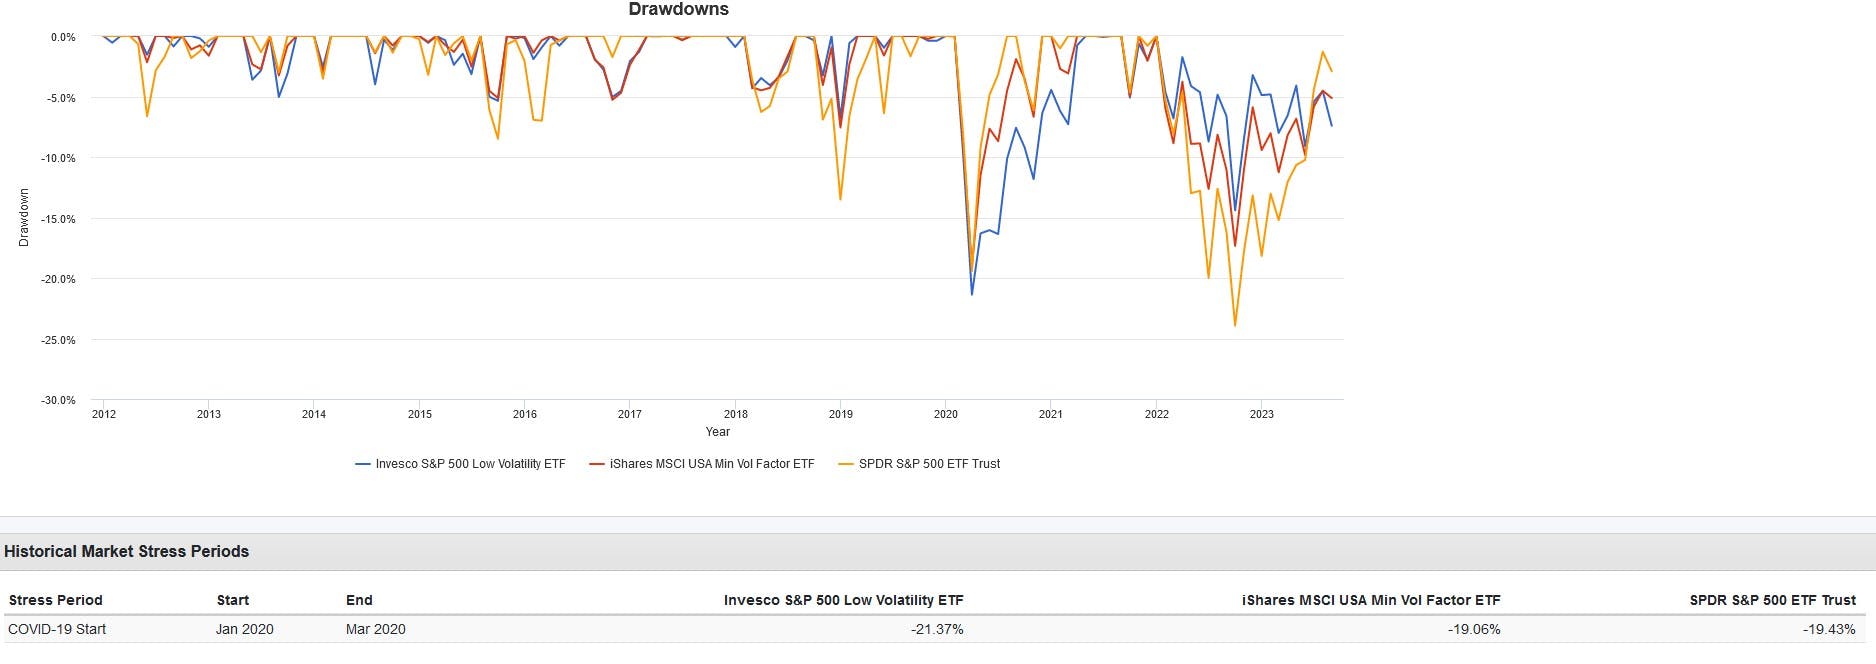
An examination of the tumultuous period during the March 2020 COVID-19 market crash brings the limitations of both strategies into sharp relief. While both ETFs boast a track record of delivering reduced drawdowns and overall volatility compared to the S&P 500 (and in the case of USMV, a competitive risk-adjusted return), during COVID crisis, they were not the havens some investors might have hoped for.


Both USMV and SPLV fell by 19.06% and 21.37% respectively, while the S&P 500 tumbled 19.3%. Neither could shield investors from the unprecedented and rapid sell-off triggered by the pandemic.
This serves as a sobering lesson for investors: while these ETFs can play a valuable role in tempering volatility and buffering portfolios, they shouldn't be viewed as panaceas. They are not a full substitute for traditional defensive assets like bonds and cash.
Instead, consider them as tools to complement a conservative strategy, offering an additional layer of diversification and risk management, but not the ultimate defense against market upheavals.
This content was originally published by our partners at ETF Central.
