
The price action in the natural gas market has been bearish since early May, when the July contract traded to a high of $2.364 per MMBtu. Last week, the price fell to a new low on the active month that traded to a bottom of $1.802 in March, when nearby futures hit a 25-year low at $1.519 per MMBtu.
July natural gas traded to a low of $1.742 on June 1 before recovering to settle last week around the $1.80 level. On the weekly chart, natural gas has made a series of marginal higher lows since March. Even though the price action has not been bullish over the past month, an emerging pattern in the energy commodity is starting to look a lot like it did in 2016. During that year, the price fell to a multi-year low and moved higher during June.
Natural gas is a highly volatile commodity that has traded as high as $15.65 and as low as $1.02 per MMBtu since 1990. In late 2018, the price reached a peak of $4.929 before it fell to $1.519 in March 2020. Over the past few months, the price action could signify that the March low was a significant bottom and that the path of least resistance is now higher.
The United States Natural Gas Fund (NYSE:UNG) is the unleveraged ETF product that follows the price of natural gas futures higher and lower. UGAZ and DGAZ are leveraged instruments for those looking to magnify the price action in the volatile natural gas future arena.
In 2017-2019, Price in June Was Higher Than Current Level
Natural gas settled at $1.782 per MMBtu level at the end of the first week of June.
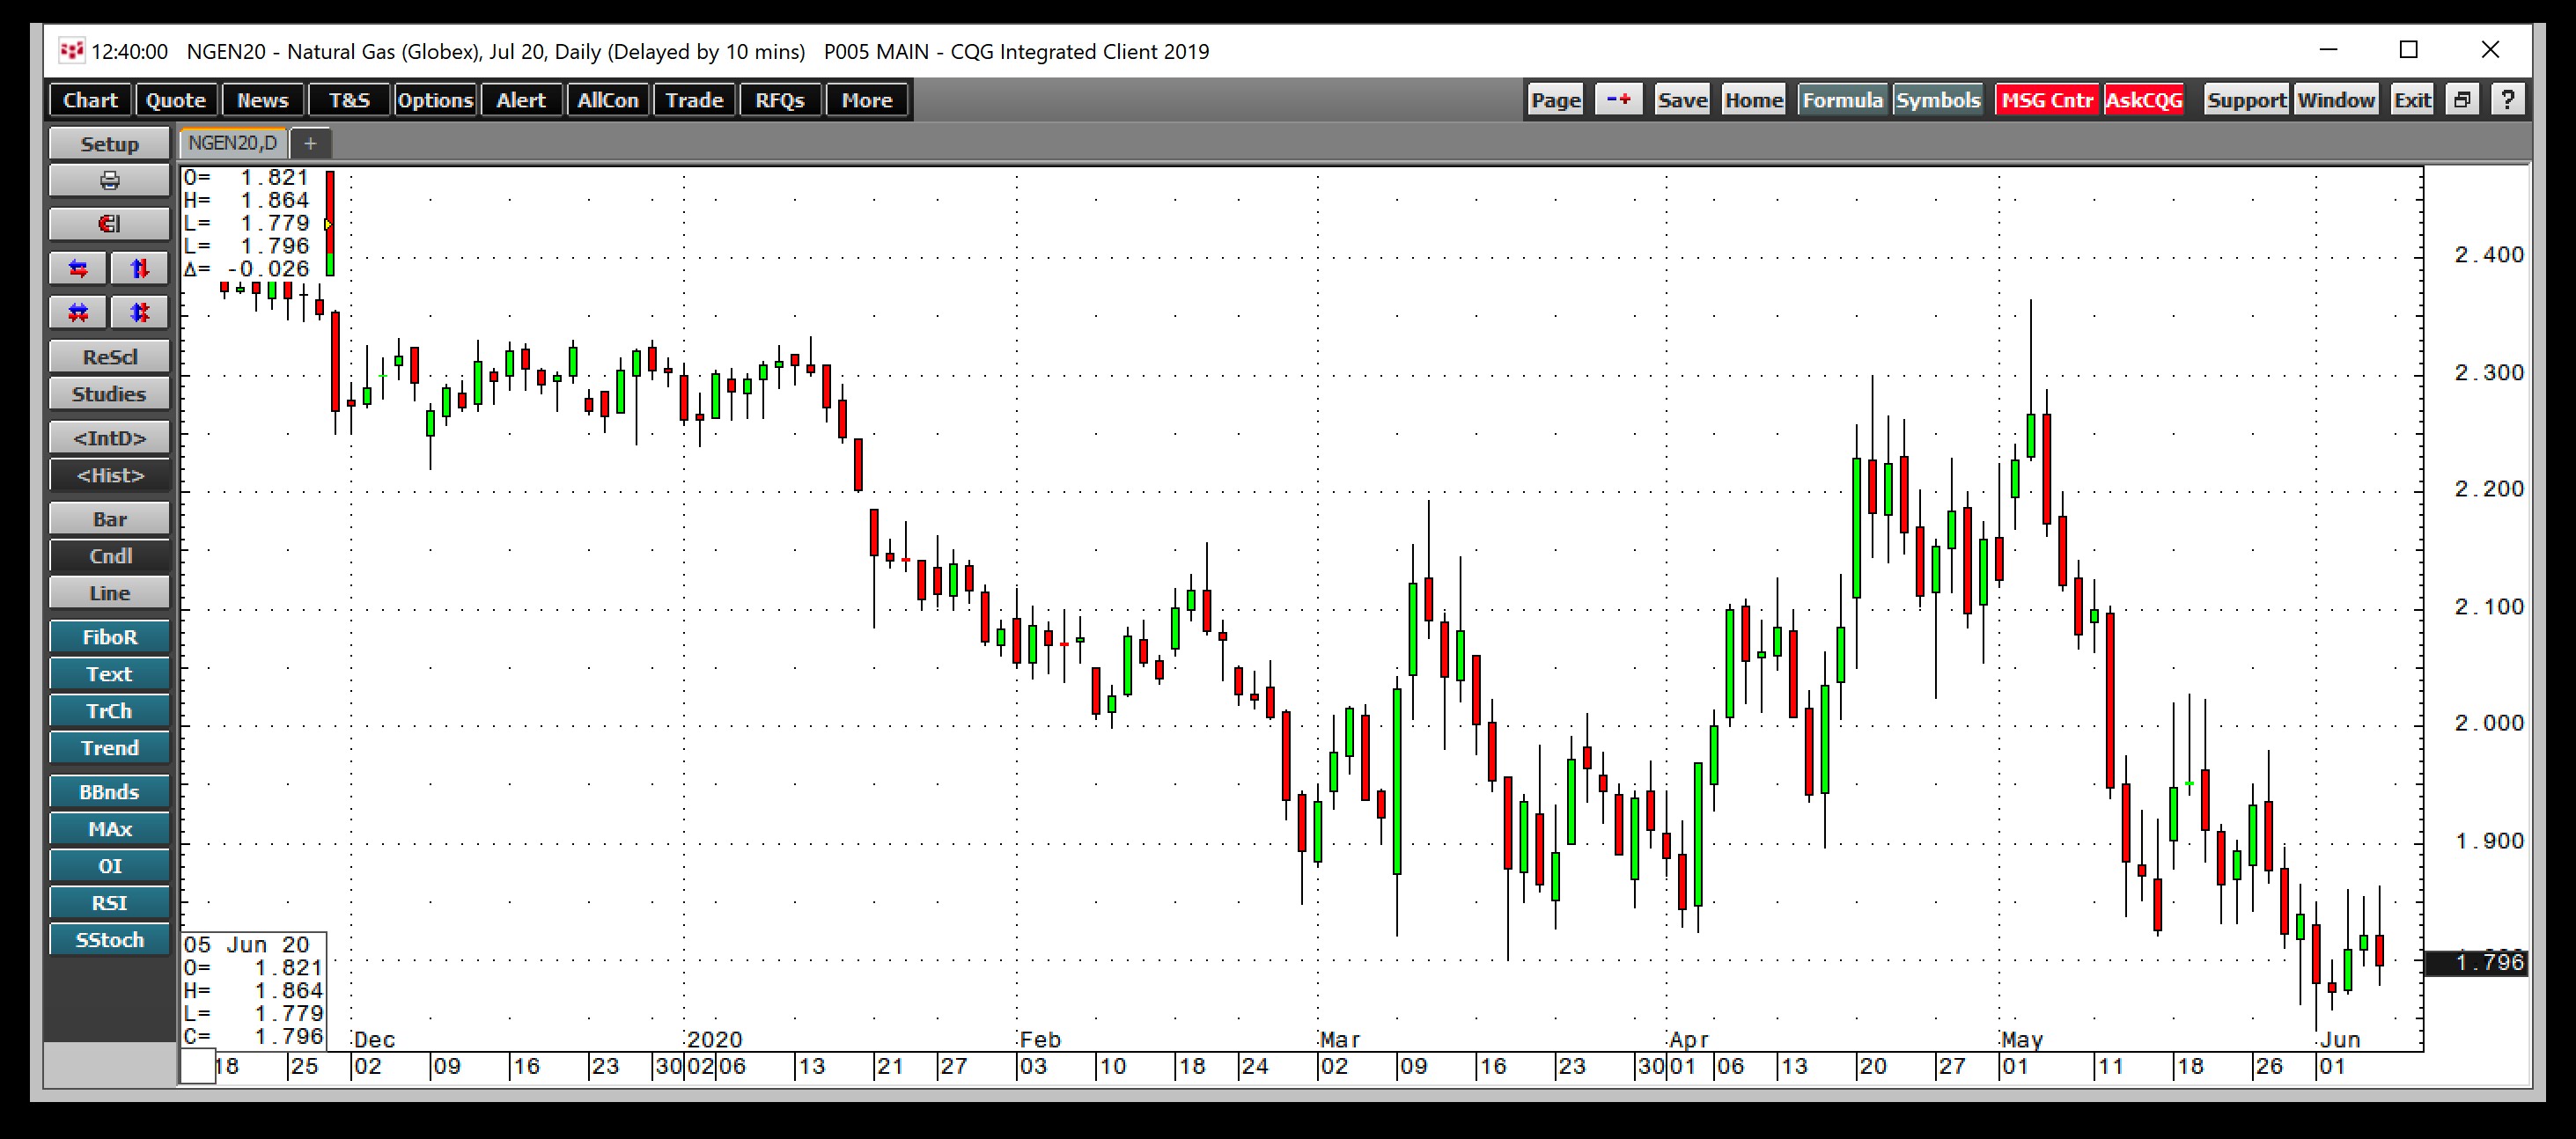
Source: CQG
In 2017, the price range of the nearby natural gas futures contract during the same week was from $2.935-$3.095. in 2018, the trading band was $2.873 to $2.987, and last year from $2.305 to $2.475 per MMBtu. Last week, the high was 44.1 cents below the lowest price over the past three years.
2020 is not an ordinary year, as the demand for energy has declined because of the global pandemic. The U.S. and Europe suffered the highest number of recorded deaths and infections over the past months. At the same time, production has declined. The number of natural gas rigs operating in the U.S. was 110 lower on a year-on-year basis at the end of last week.
In June 2016 Natural Gas Took Off On The Upside
In March, natural gas fell to the lowest price since 1995, when it fell to $1.519. In 2016, the bottom was at $1.611, and natural gas made a series of higher lows from March through May, leading to a recovery.

Source: CQG
The chart highlights the trading pattern that gave way to a significant price recovery during June that took natural gas to just below the $3 per MMBtu level.
Higher Lows Since March, Just Like Four Years Ago
The pattern over the past weeks is looking similar to 2016.
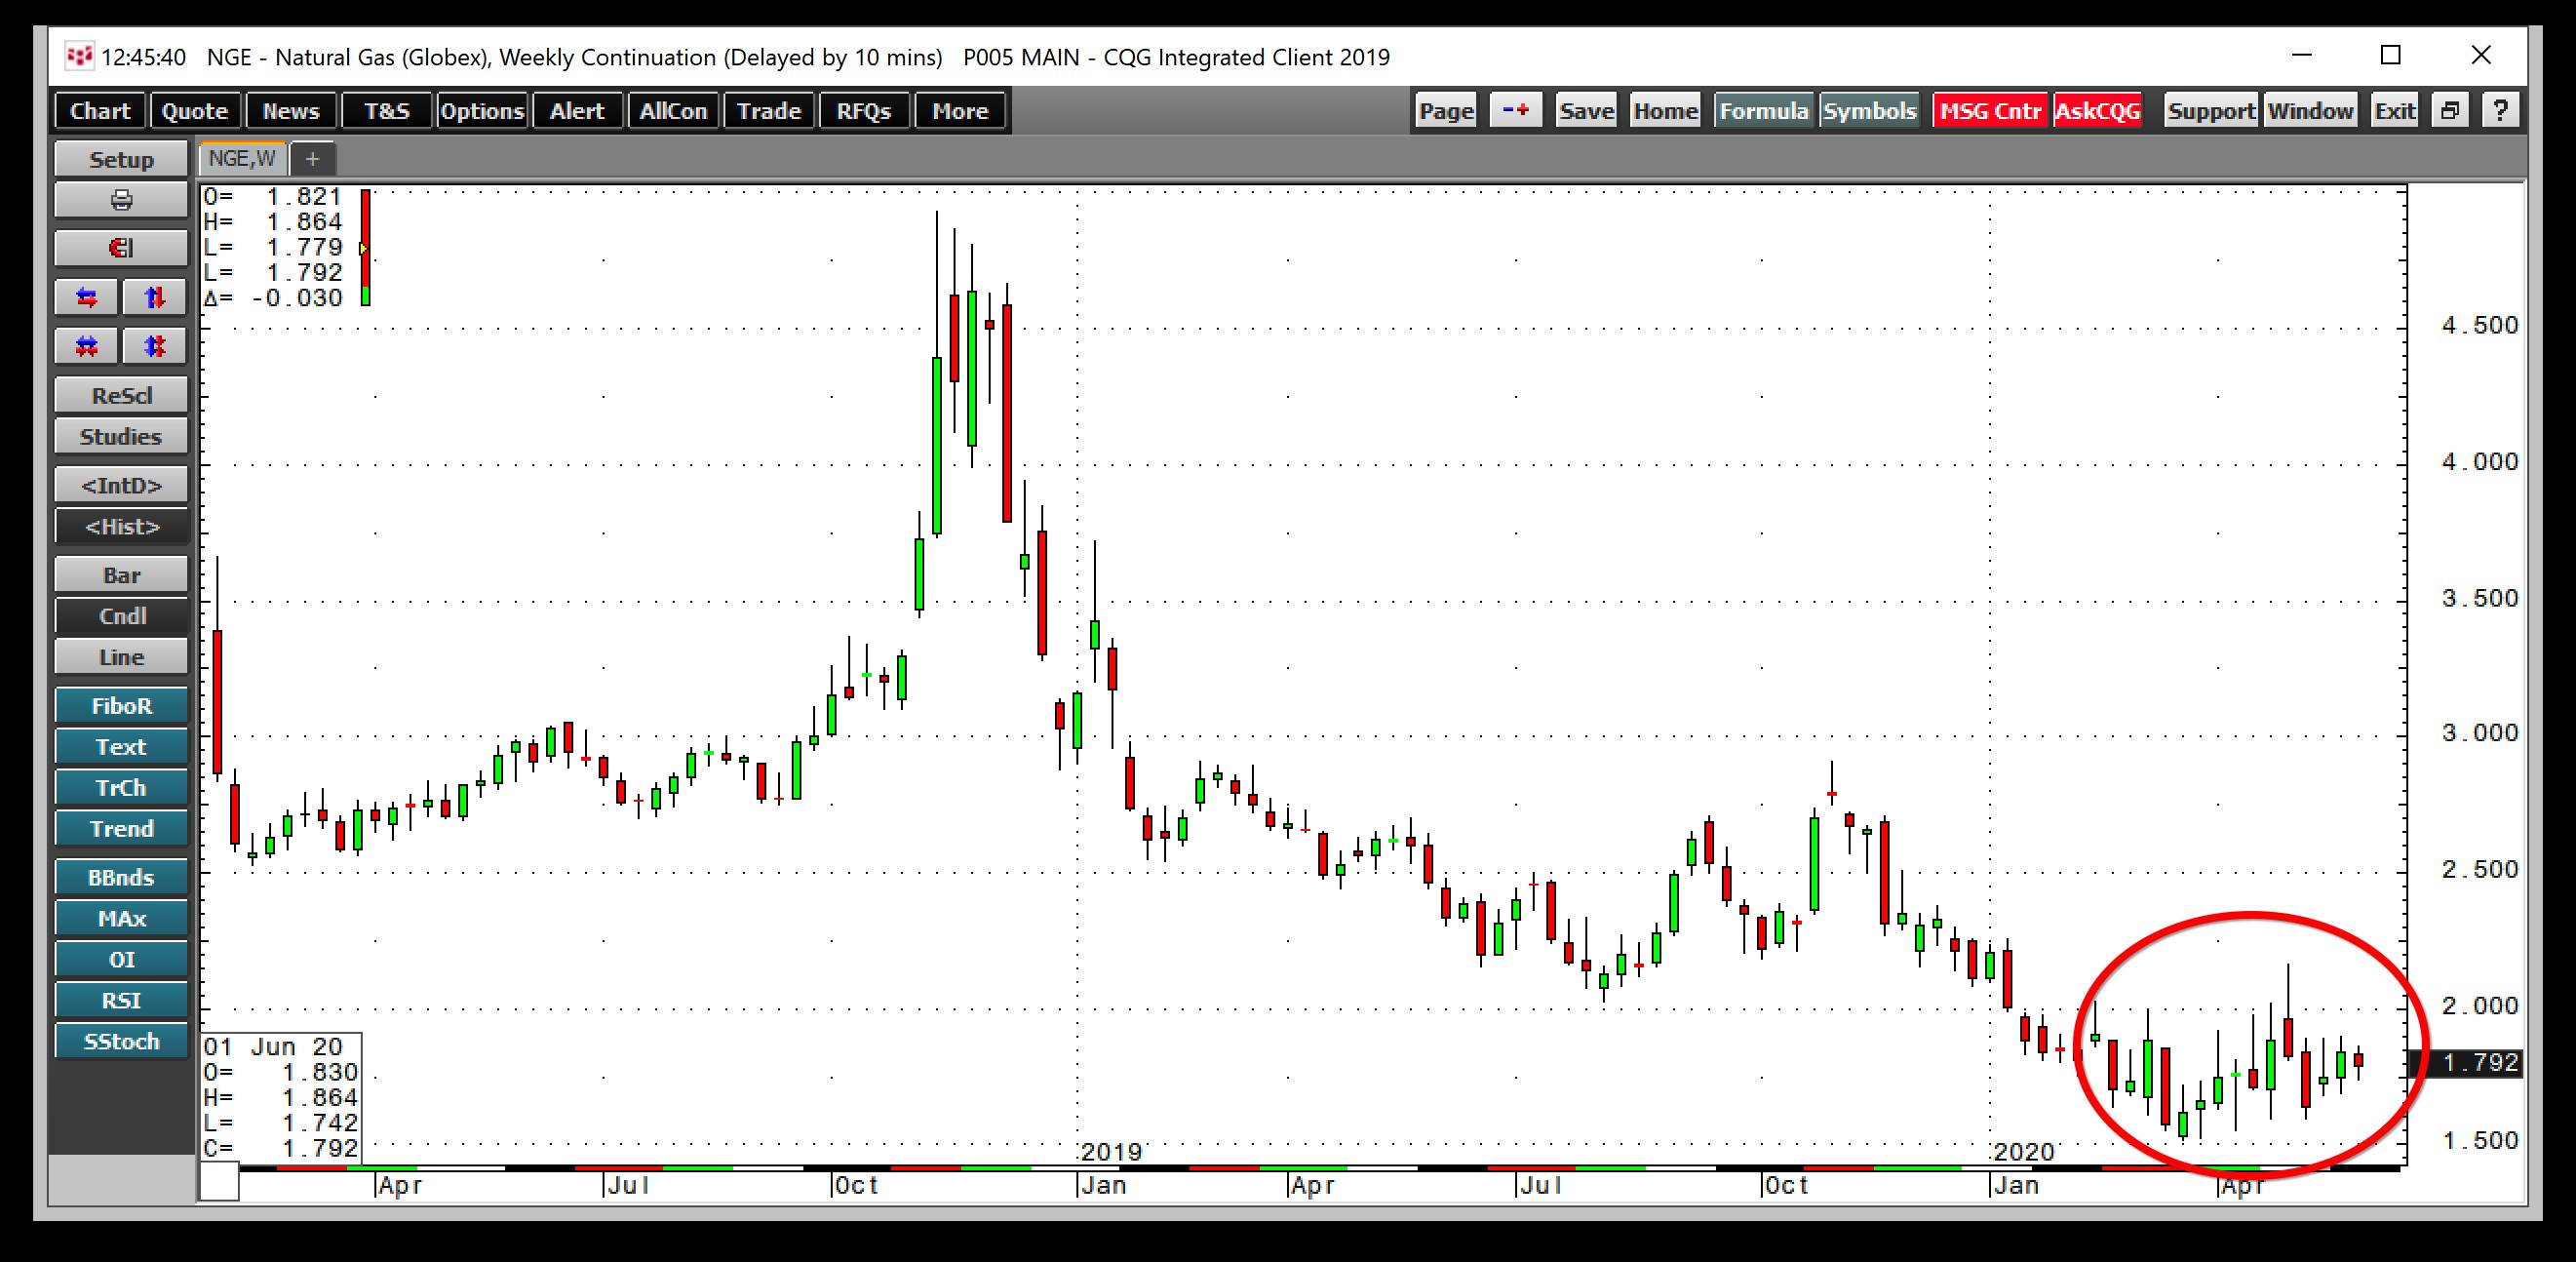
Source: CQG
Nearby natural gas futures have made marginally higher lows since the March bottom. In 2016, natural gas broke out to the upside. The price probed above the $2 per MMBtu level during the final week of April and the first week of May. Technical resistance stands at the $2.162 level. A move above that price could leave the $2 level in the dust as it did in 2016. After moving higher, natural gas had not returned to $2 until early 2020.
History tends to rhyme over time. Natural gas could be setting the stage for a recovery, following in the footsteps of the crude oil market that has risen from the ashes since April. If 2016 is a model, buying dips with stops above recent lows could be the optimal approach to the energy commodity over the coming weeks.