Low-cost exchange-traded funds (ETFs) could enable new investors to put some of their savings into equity markets. Today, we introduce three funds that are made up of a diversified range of securities.
Given the strength in broader equity markets over the past 12 months, all three funds are currently hovering at record highs. April means the start of a new quarter as well as the earnings season, therefore, there could be increased volatility and short-term profit-taking in many of the darlings of Wall Street. However, buy-and-hold investors could regard these potential drops as opportunities to buy into these ETFs.
Let's take a closer look.
1. iShares Core S&P Total US Stock Market ETF
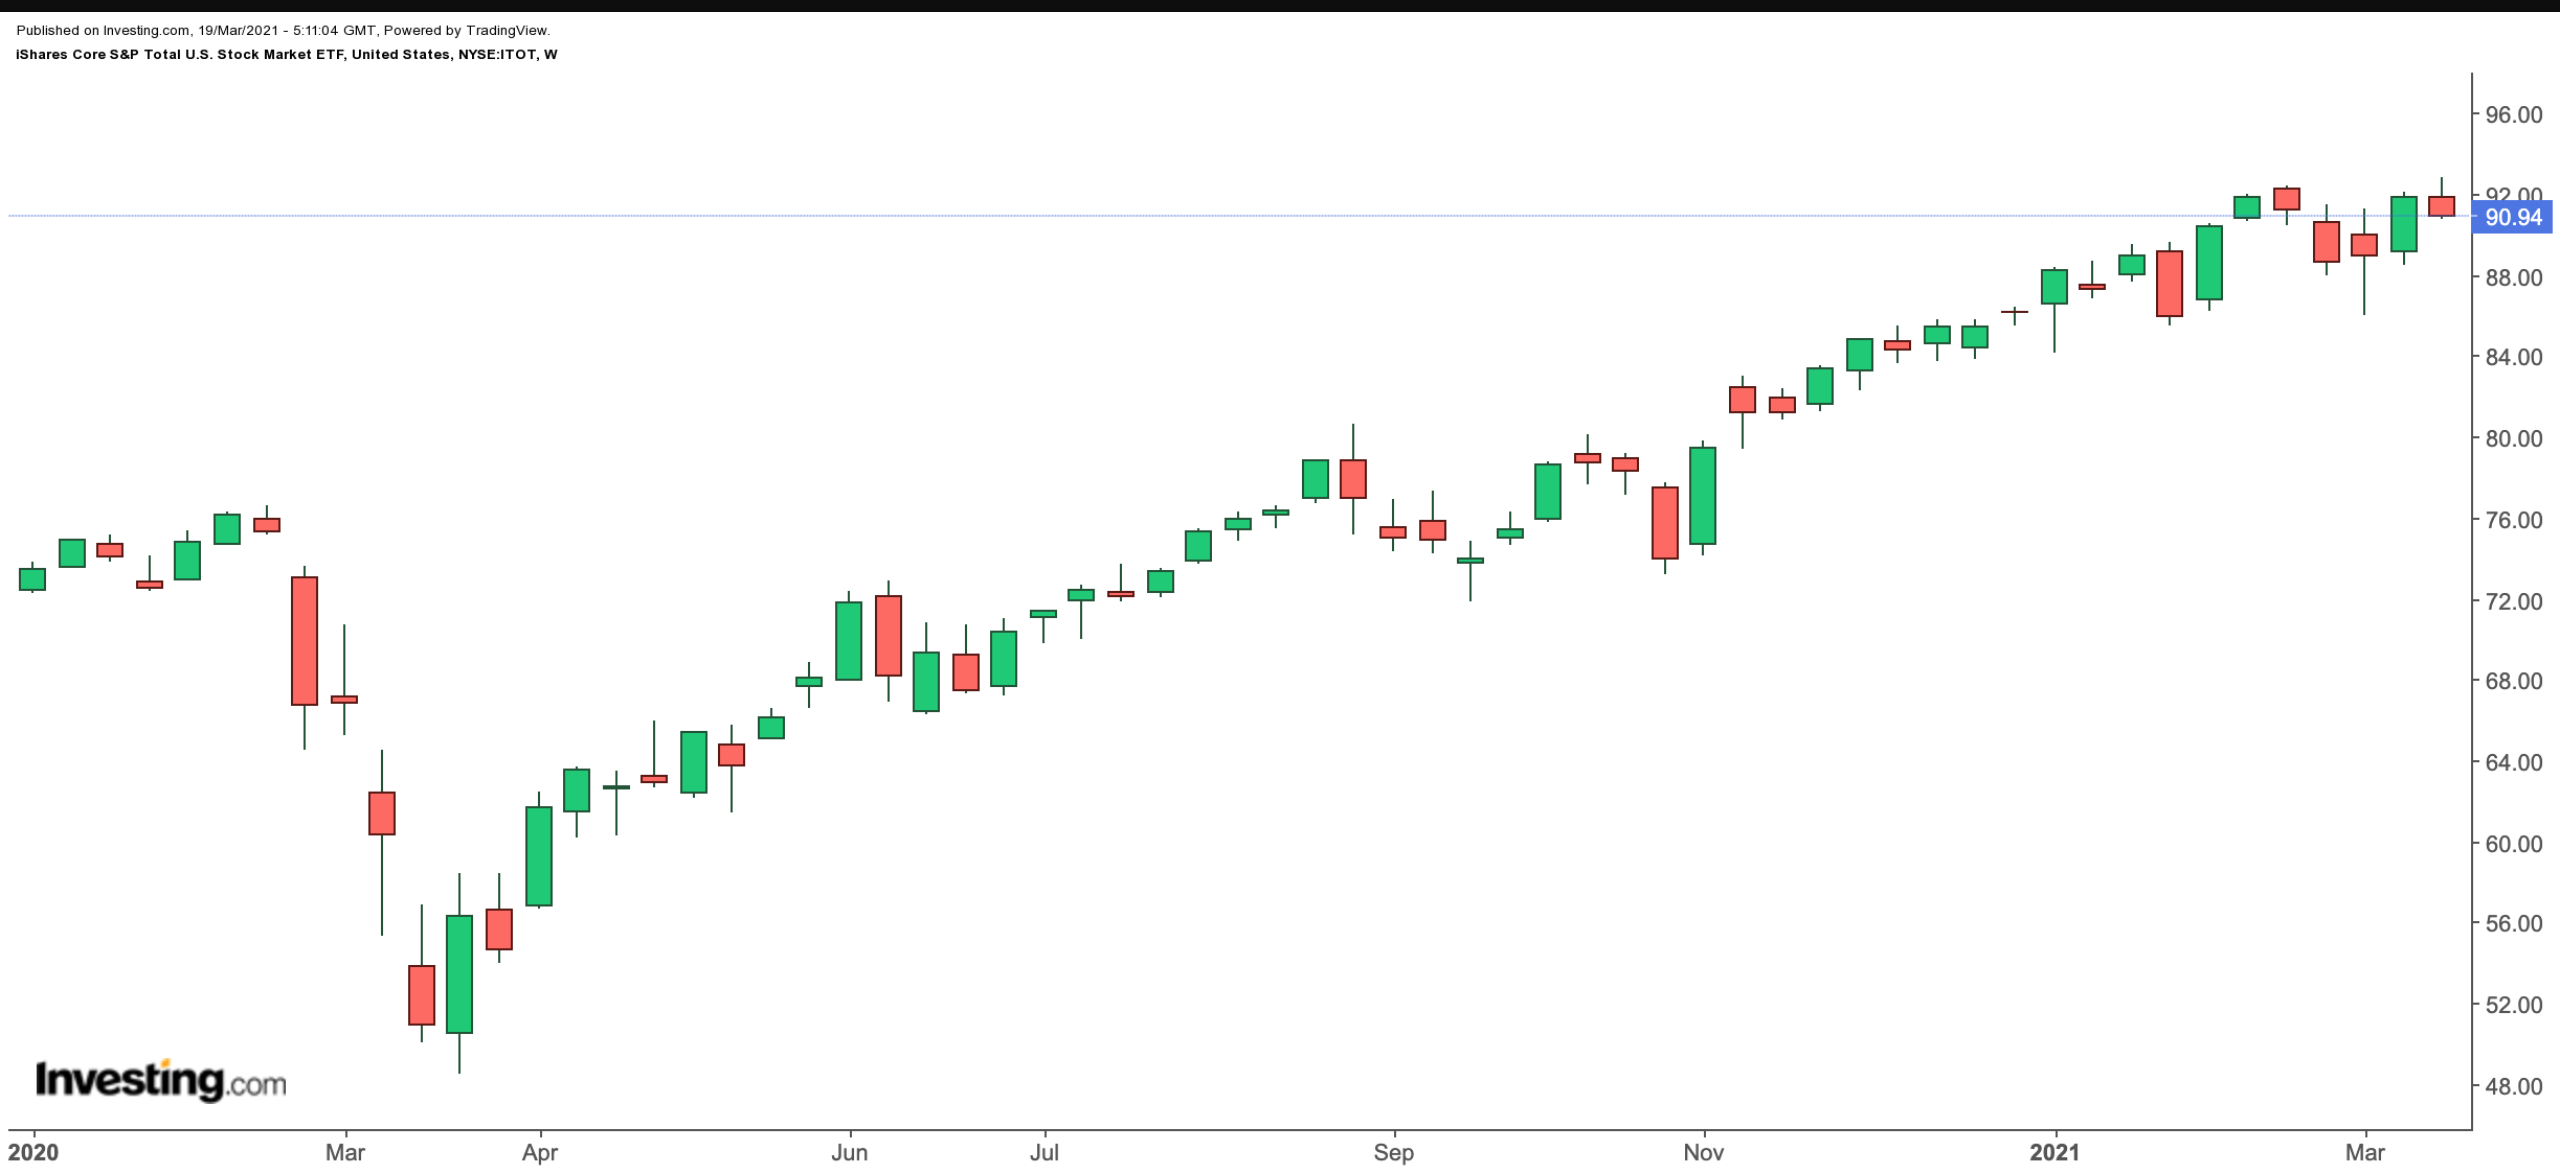
Current Price: $90.94
52-Week Range: $48.52 - $92.79
Dividend Yield: 1.33%
Expense Ratio: 0.03% per year
The iShares Core S&P Total US Stock Market ETF (NYSE:ITOT) provides exposure to the total US stock market, ranging from smallest to the largest companies. The fund started trading in January 2004.

With its 3,588 holdings, ITOT tracks the returns of the S&P Total Market Index. The top 10 stocks make up approximately 22% of total net assets, which stand close to $36.4 billion. The top three sectors (by weighting) are information technology, health care and consumer discretionary.
ITOT's leading names are Apple (NASDAQ:AAPL), Microsoft (NASDAQ:MSFT), Amazon (NASDAQ:AMZN), Facebook (NASDAQ:FB), Alphabet (NASDAQ:GOOG) (NASDAQ:GOOGL) and Tesla (NASDAQ:TSLA).
Over the past year, the ETF has returned about 73%. Year-to-date (YTD), the fund is up 6% and hit a record high. Any potential decline toward the $85 level could act as a better entry point for buy-and-hold investors. ITOT is one of the lowest-cost ETFs to buy on the market, creating almost zero drag on returns.
2. SPDR Portfolio S&P 500 Value ETF
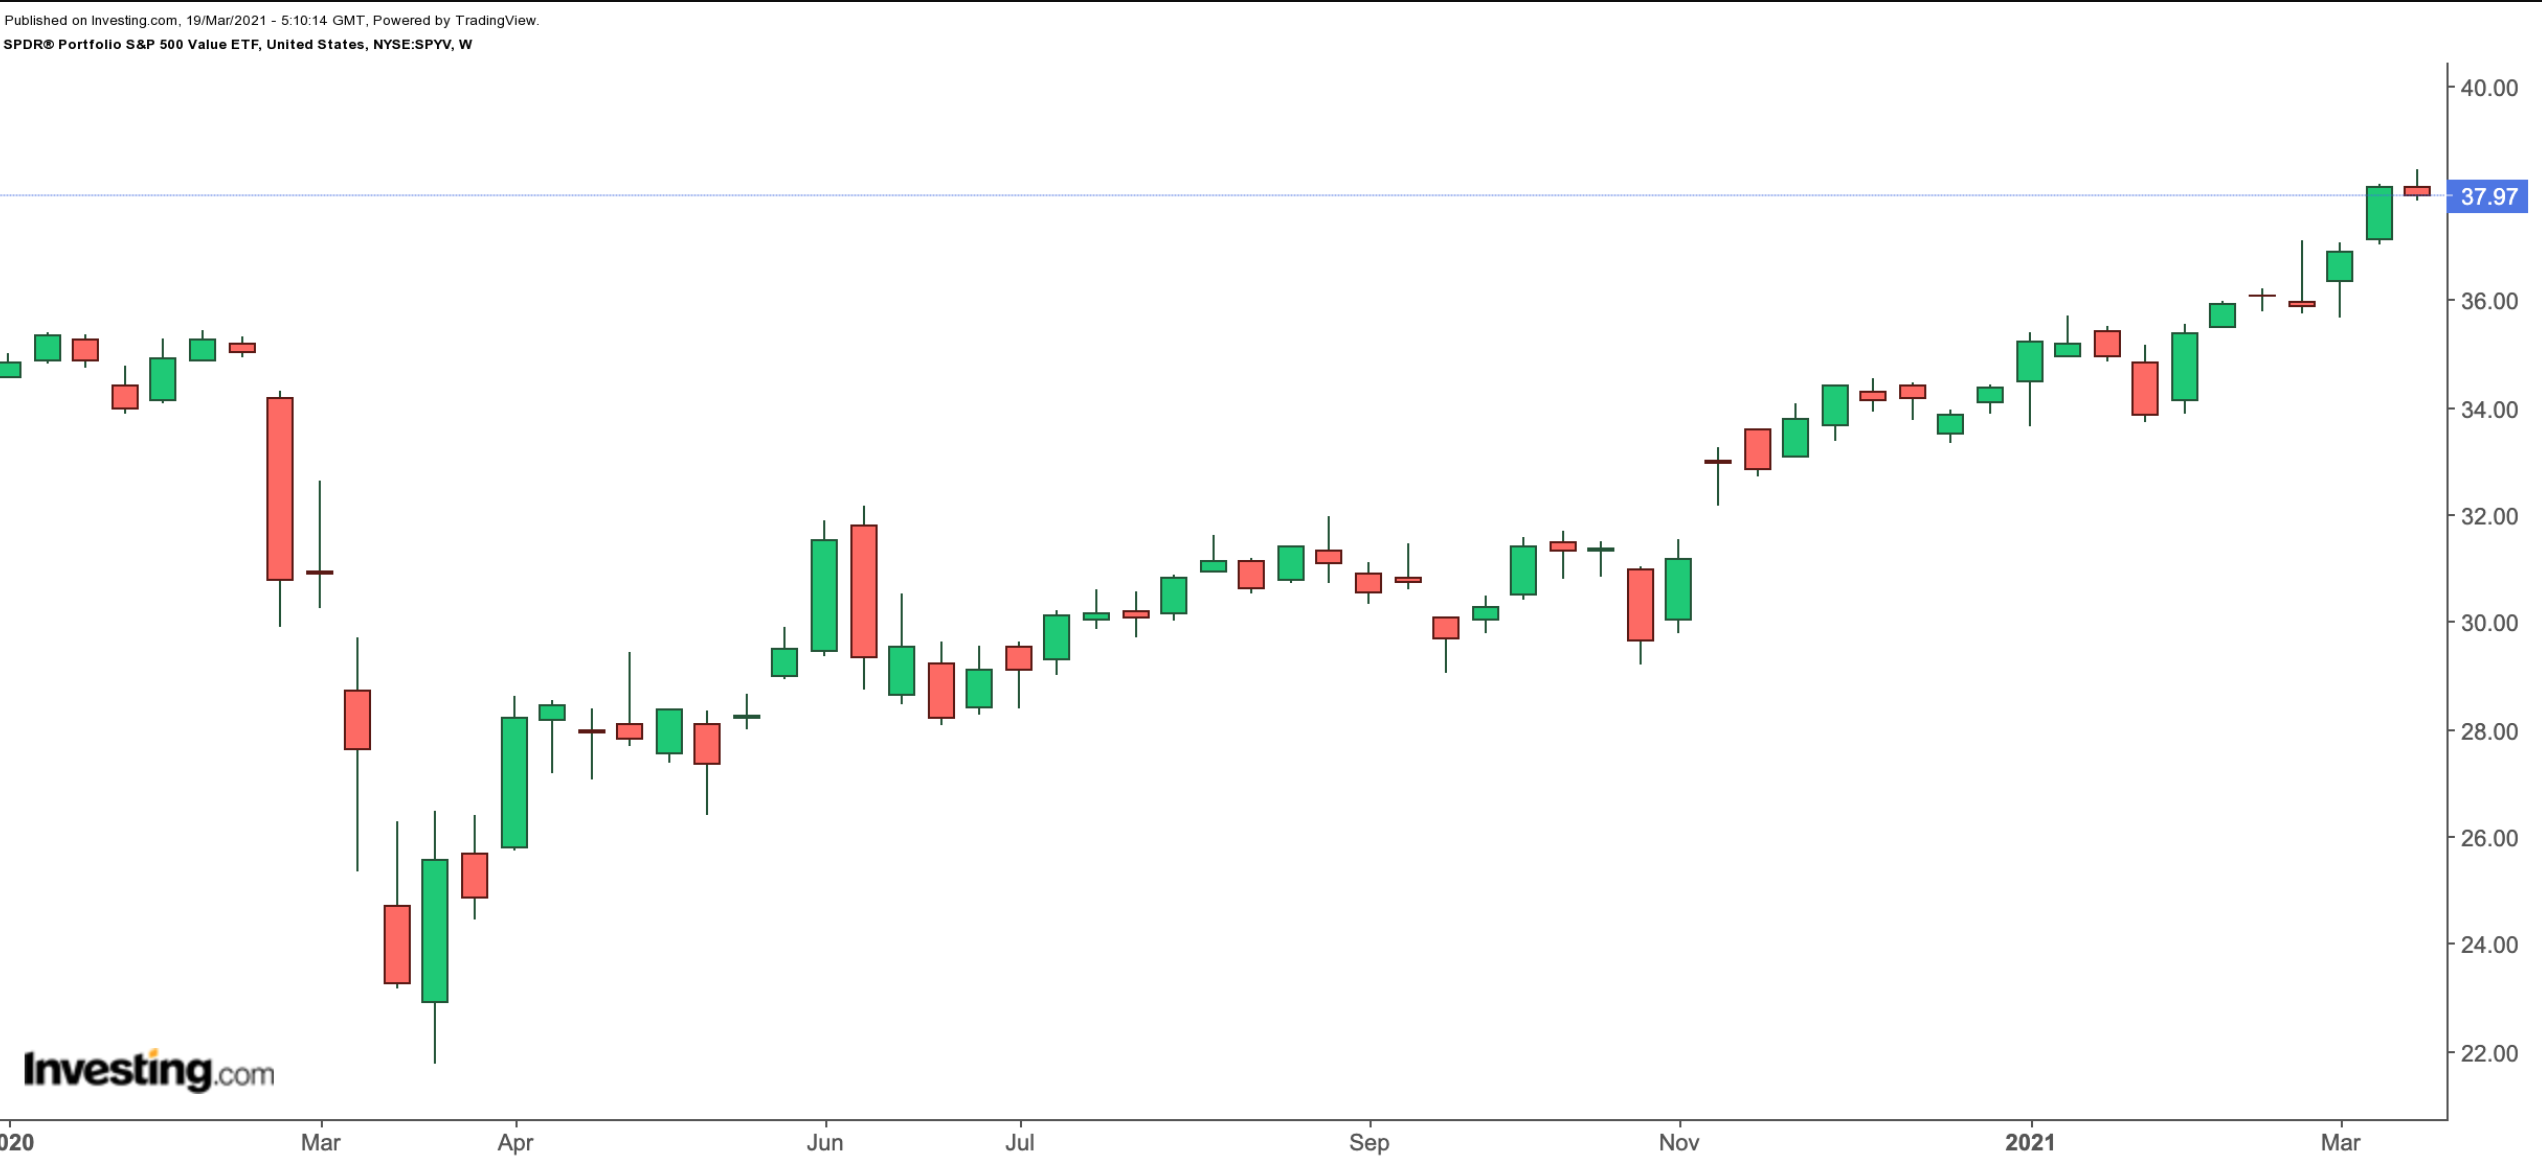
Current Price: $37.97
52-Week Range: $21.77 - $38.34
Fund Dividend Yield: 2.14%
Expense Ratio: 0.04 % per year
The SPDR® Portfolio S&P 500 Value ETF (NYSE:SPYV) invests in businesses that could be undervalued relative to their peers or the broader market. Since its inception in September 2000, assets under management have grown close to $10 billion.

SPYV, which follows the S&P 500 Value Index, has 436 holdings. This benchmark index consists of those companies in the S&P 500 Index exhibiting the strongest value characteristics based on book-value-to-price ratio, earnings-to-price ratio and sales-to-price ratio.
The most important sectors by weighting are health care, financials, consumer staples and IT. Close to 20% of the fund is invested in the top 10 stocks. Berkshire Hathaway B (NYSE:BRKb), JPMorgan Chase (NYSE:JPM), Walt Disney (NYSE:DIS), Bank of America (NYSE:BAC), Intel (NASDAQ:INTC) and Johnson & Johnson (NYSE:JNJ) are currently among the leading stocks on the roster.
The ETF is up about 56% in the past 52 weeks and 11% YTD. A potential decline toward the $35 level would improve the margin of safety.
3. Vanguard Dividend Appreciation ETF
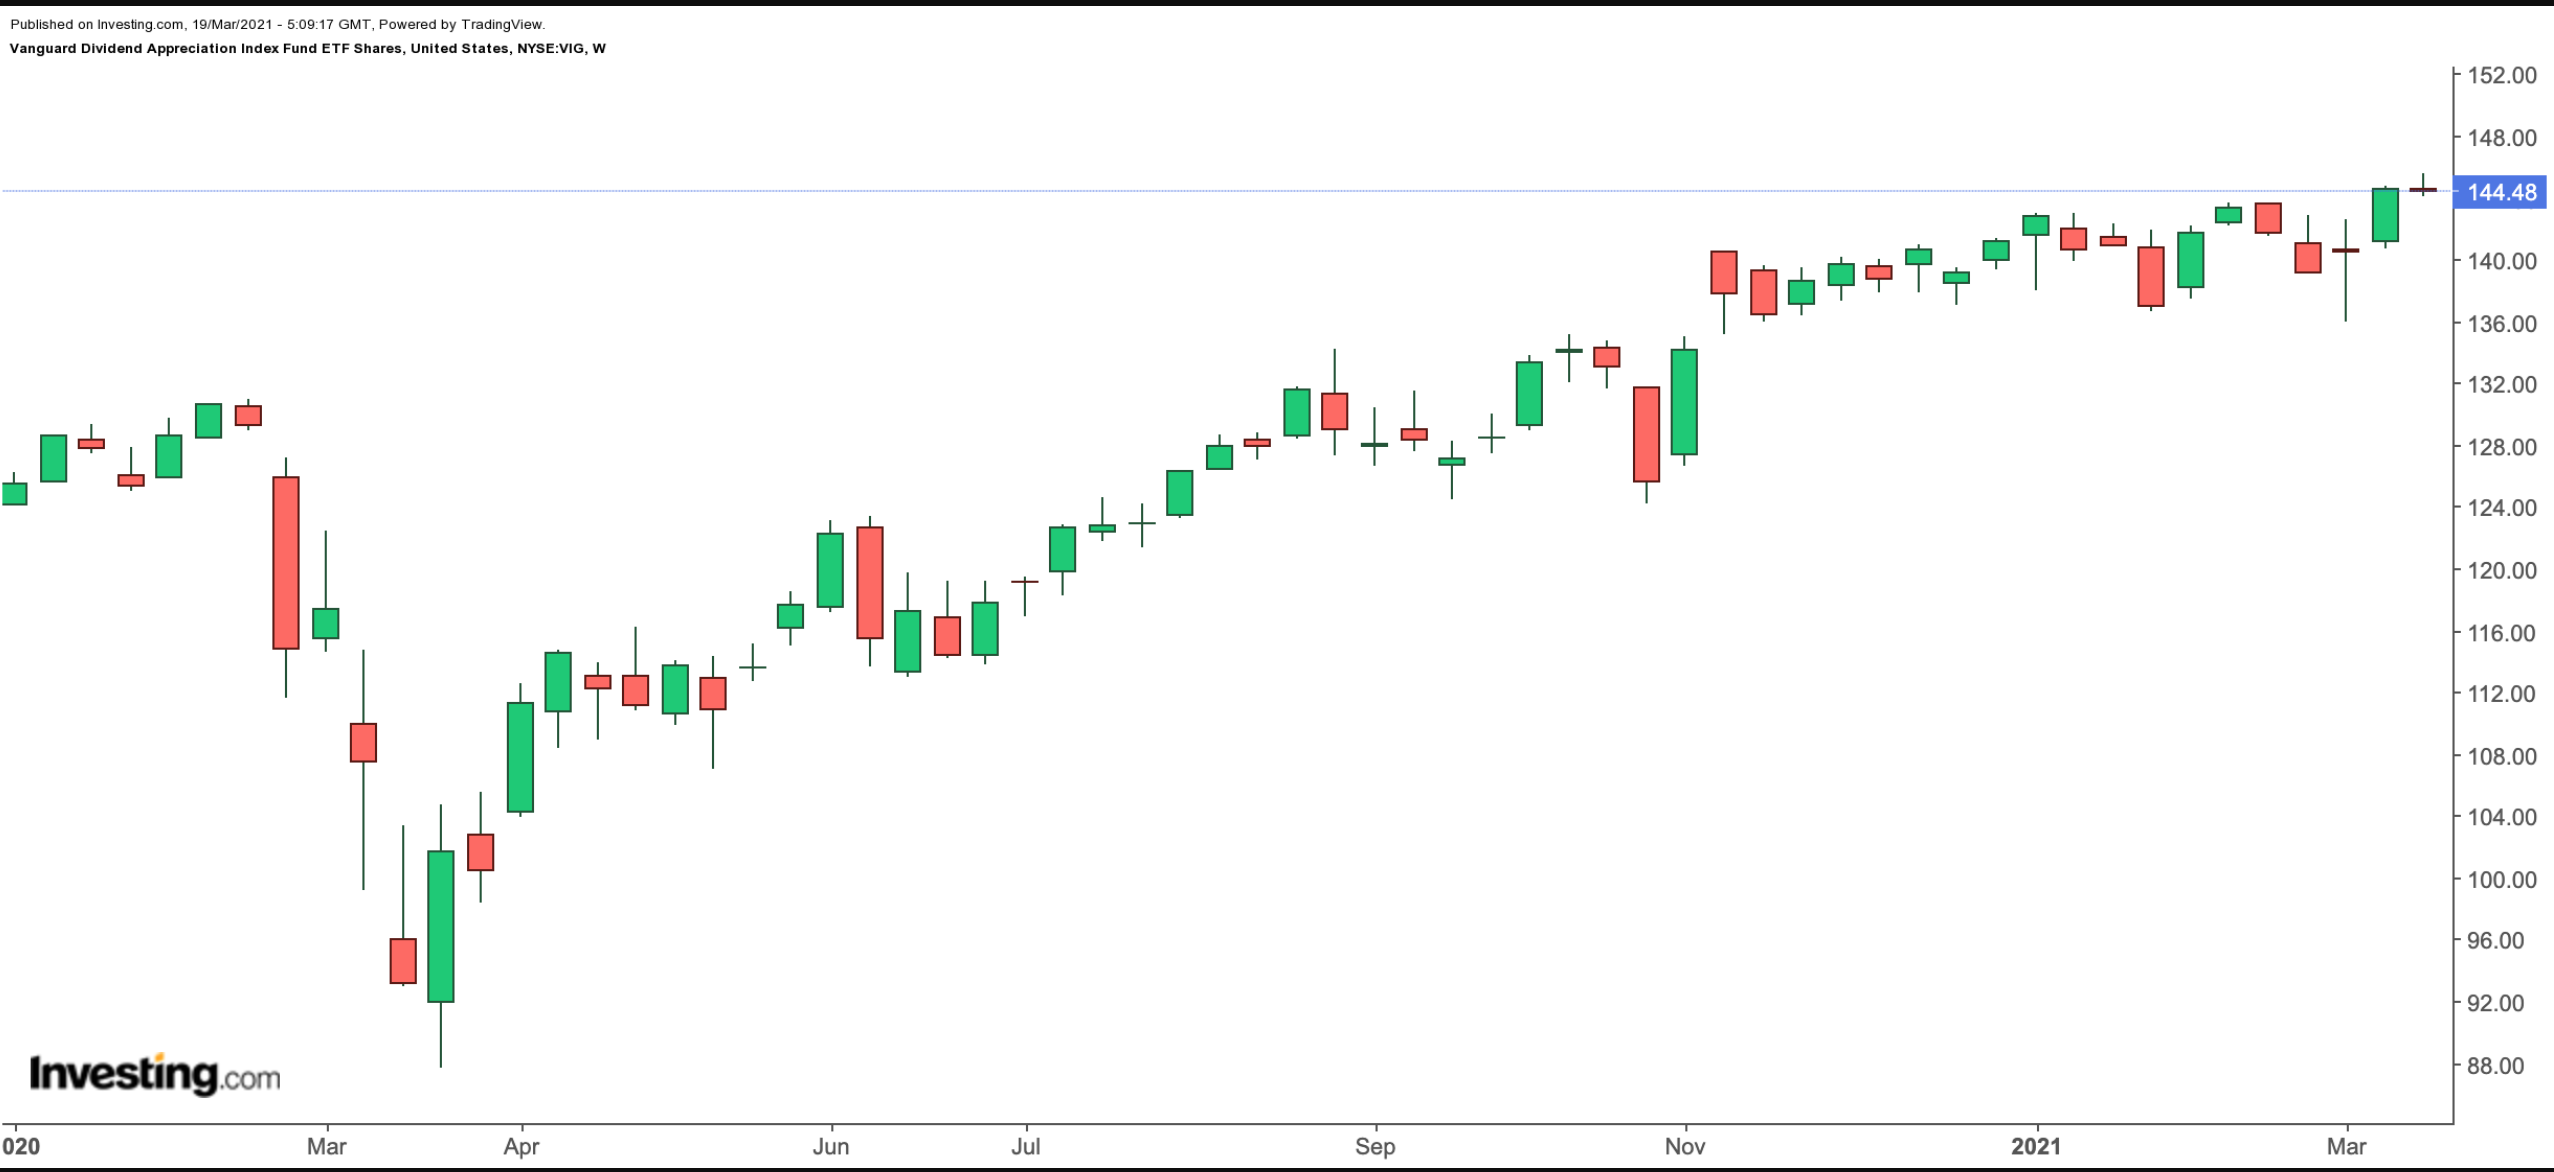
Current Price: $144.48
52-Week Range: $87.71 - $145.63
Dividend Yield: 1.58%
Expense Ratio: 0.06% per year
The Vanguard Dividend Appreciation Index Fund ETF (NYSE:VIG) invests in companies with a record of growing their dividends year over year. Seasoned investors appreciate the importance of including dividend shares in diversified portfolios. One important criterion they look for is the ability of a business to increase the amount of the dividend payout. Such stability usually points to the management's ability to grow long-term earnings. Those businesses with stable dividends tend to appeal to retirement portfolio holders. These shares usually exhibit lower volatility over time and do not lose much value even during market selloffs.

VIG, which holds 212 stocks, tracks the NASDAQ US Dividend Achievers Select Index. The fund began trading in April 2006. The top 10 companies make up 34.7% of net assets of $63.2 billion.
Microsoft, Walmart (NYSE:WMT), Walt Disney, Johnson & Johnson, Visa (NYSE:V), UnitedHealth Group (NYSE:UNH) and Procter & Gamble (NYSE:PG) are among the leading names in the fund.
It has gained 46% in the past 12 months and 2.5% YTD. Like our other two funds, VIG also hit an all-time high in March. A potential decline below $140 would make the risk/return ratio more attractive.
