by Noreen Burke
The US dollar's correlation with a number of key US instruments is shaping an unusual pattern generally associated with periods of market turbulence, according to BNY Mellon’s chief currency strategist Simon Derrick.
“It seems worth highlighting that the levels of correlation currently being seen between the USD Index and key US asset markets have previously been associated with either the run up to or the aftermath of major market events."

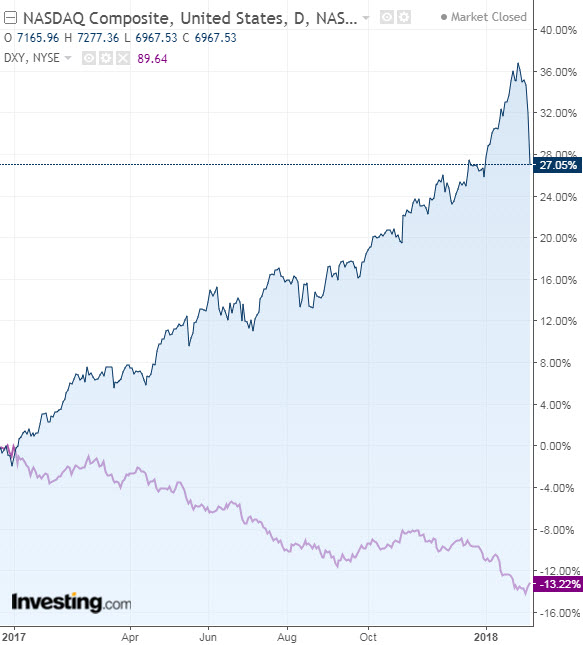
In a note to clients, Derrick said the 200-day rolling correlation for the NASDAQ Composite against the dollar index is standing at -74.8%.

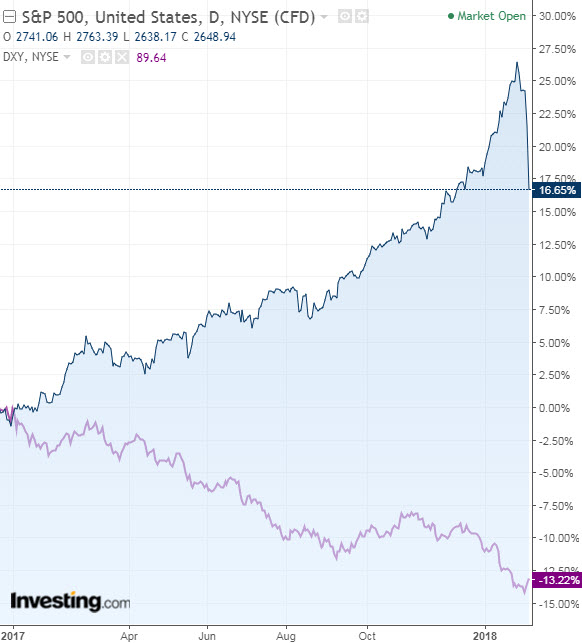
There is a -74% correlation between the dollar index and the Dow Jones Industrial Average, and -73.9% correlation to the S&P 500.
A correlation of -100% indicates that a move higher by one asset would be matched by an equal move lower by the other asset. A correlation of 100% would mean that the two assets move together in the same direction.

The correlation between the dollar and the Treasury yield curve is not far behind, according to Derrick. The correlation between the dollar index and the U.S. government 2-year/30-year yield gap stands at 68.8%, he said.
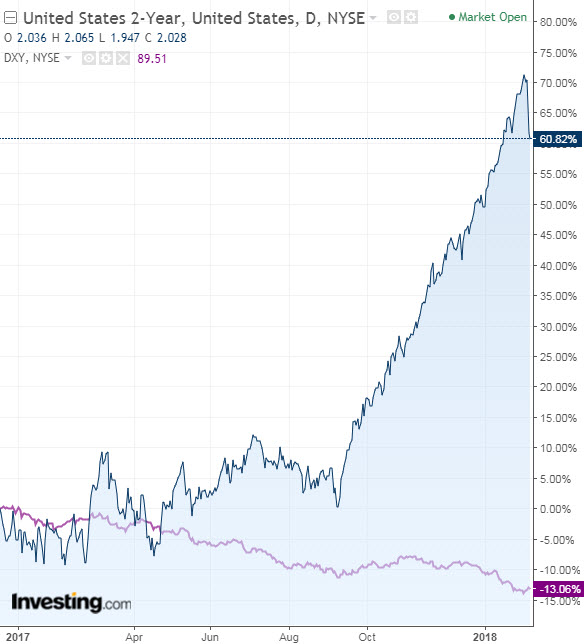
The correlation between the dollar index and “outright Treasury yields are catching up rapidly with both groups with the number against the 2-year at -65.6%,” Derrick said.
Rare Collective Occurrence
He noted that it's rare for correlations of this strength to appear collectively for any length of time; it's happened just three times over the past 40 years.
The first instance occurred in late 1978, during the latter stages of a two-year dollar downtrend fueled by lax US monetary policy. The gap between headline inflation and the Fed Funds rate stood at similar levels to those seen over the past few years.
This move, in turn helped the S&P 500 sustain its post-1974 rally. However, at the time the Fed was tightening policy as it fought to bring inflation back under control.
The three-month period during which the correlations reached the extremes currently on view coincided with the dollar finding a base as the Fed continued to tighten. It culminated with a 15% slide in the S&P 500.
The second time came in the summer of 1987 and coincided with the latter stages of the post-Plaza Accord dollar downtrend. The 1985 Plaza Accord was an agreement between what was then the G-5 nations—West Germany, France, the US, Japan and the UK—to manipulate exchange rates by depreciating the US dollar against the Japanese yen and West Germany's currency at the time, the Deutsche mark, with the aim of correcting trade imbalances. In that case however, the yield curve correlations did not reach the current extremes.
At that time the Fed was tightening policy in order to stabilize the dollar and a sudden rise in inflationary pressures, while the S&P 500 continued to rally aggressively. The correlations abruptly fell apart in October 1987 following Black Monday, when stock markets around the world crashed and the Dow plunged 507.99 points.
The note said the third time came between December 2008 and May 2009, but this period differed from the previous two because it happened after, rather than before, a major stock market slide.
