⭐ Start off 2025 with a powerful boost to your portfolio: January’s freshest AI-picked stocksUnlock stocks

Real Estate Sector Suffers Third Weekly Loss Amid Rising Treasury Yields

Published 2024-04-22, 10:25 a/m


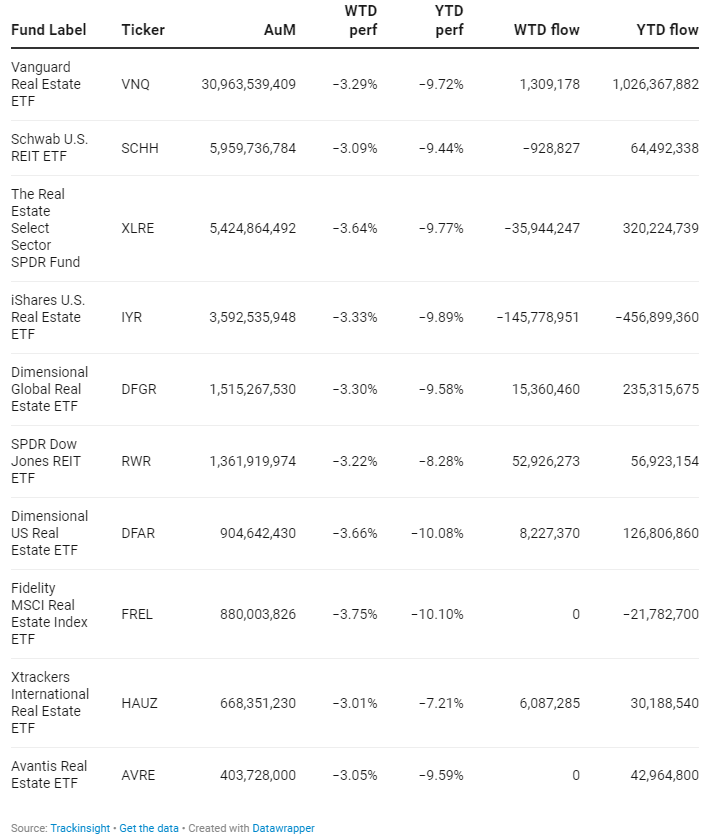
Real estate ETFs are facing significant headwinds, entering their third consecutive week of downturns (-3.16% week over week) and affirming their position as this year's laggard with a 9.3% year-to-date loss. This article delves into the challenges faced by Real Estate ETFs amidst the prevailing high interest rate environment.

The Impact of High Interest Rates on Real Estate

The performance of the real estate sector is closely tied to interest rate movements. High interest rates increase borrowing costs for purchasing properties, which logically dampens investment in real estate. This fundamental truth has been starkly evident in recent times. Concerns about rising Treasury yields were even intensifying this week as Atlanta Fed President Raphael Bostic warned that the U.S. central bank could hike interest rates if inflation remained sticky. Therefore, it comes as no surprise that the U.S. 10-year Bond yield has increased by 74 basis points since the end of 2023. This constraint is all the more significant as the sector is already facing serious challenges such as rising vacancy rates and changing demands for office space in the wake of the COVID-19 pandemic.

Shifting Expectations and Continued Struggles

Investors had harbored hopes of a rate cut by the Federal Reserve in the second quarter of the year. However, the announcement that such a cut would not materialize until at least next September shattered these expectations. This delay is particularly detrimental to the real estate sector, known for its sensitivity to interest rate fluctuations.

ETF focus

As an illustration, the Vanguard Real Estate ETF (VNQ+0.35%), managing almost $31 billion in assets, lost 3.29% for the week, registering a year-to-date performance of -9.72%. The iShares U.S. Real Estate ETF (IYR+0.34%) recorded a weekly decline of 3.33% over the week and suffered $146 million in outflows.

Group Data

Group Data

Index Data

Index Data

Funds Specific Data: VNQ, SCHH, XLRE, IYR, DFGR, RWR, FREL, HAUZ, AVRE

Funds Specific Data: VNQ, SCHH, XLRE, IYR, DFGR, RWR, FREL, HAUZ,
This content was originally published by our partners at ETF Central.

Latest comments

Loading next article…
Risk Disclosure: Trading in financial instruments and/or cryptocurrencies involves high risks including the risk of losing some, or all, of your investment amount, and may not be suitable for all investors. Prices of cryptocurrencies are extremely volatile and may be affected by external factors such as financial, regulatory or political events. Trading on margin increases the financial risks.
Before deciding to trade in financial instrument or cryptocurrencies you should be fully informed of the risks and costs associated with trading the financial markets, carefully consider your investment objectives, level of experience, and risk appetite, and seek professional advice where needed.
Fusion Media would like to remind you that the data contained in this website is not necessarily real-time nor accurate. The data and prices on the website are not necessarily provided by any market or exchange, but may be provided by market makers, and so prices may not be accurate and may differ from the actual price at any given market, meaning prices are indicative and not appropriate for trading purposes. Fusion Media and any provider of the data contained in this website will not accept liability for any loss or damage as a result of your trading, or your reliance on the information contained within this website.
It is prohibited to use, store, reproduce, display, modify, transmit or distribute the data contained in this website without the explicit prior written permission of Fusion Media and/or the data provider. All intellectual property rights are reserved by the providers and/or the exchange providing the data contained in this website.
Fusion Media may be compensated by the advertisers that appear on the website, based on your interaction with the advertisements or advertisers.
© 2007-2025 - Fusion Media Limited. All Rights Reserved.