⭐ Start off 2025 with a powerful boost to your portfolio: January’s freshest AI-picked stocksUnlock stocks

Reflationary Signals Bode Well For Precious Metals, Oil In 2016

Published 2015-11-08, 01:33 a/m
USD/JPY
-
XAU/USD
-
XAG/USD
-
JP225
-
GC
-
SI
-
CL
-

- A few quick thoughts from around the markets

For tactical traders, the fractal comparative we've followed between the Nikkei and yen (09') appears to be nearing another downside pivot.
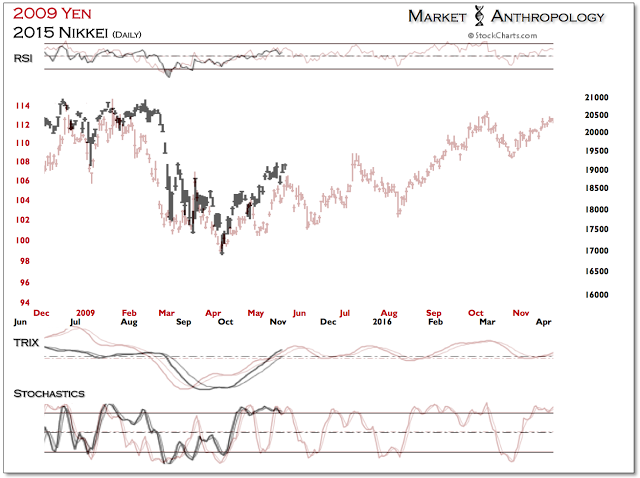
Figure 1: Daily JPY 2009 vs Nikkei 2015

From a longer-term perspective, although we are looking for the negative correlation between the Nikkei and yen to continue to thaw as it did from the previous extreme in Q2 2009, over the short-term, they could continue to mirror performance moves (Figure 3) - while also gradually trending higher.

Our basic read is that the yen will take another step higher in the near term, with greater upside risk should equities loose previous support from early fall. That said, we believe Japanese markets are on another reflationary path.
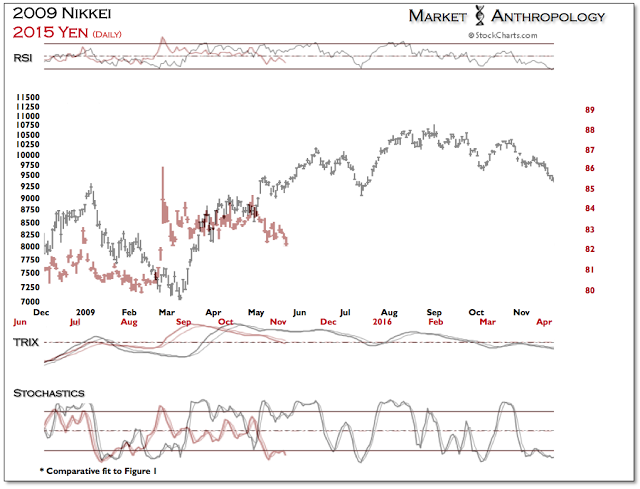
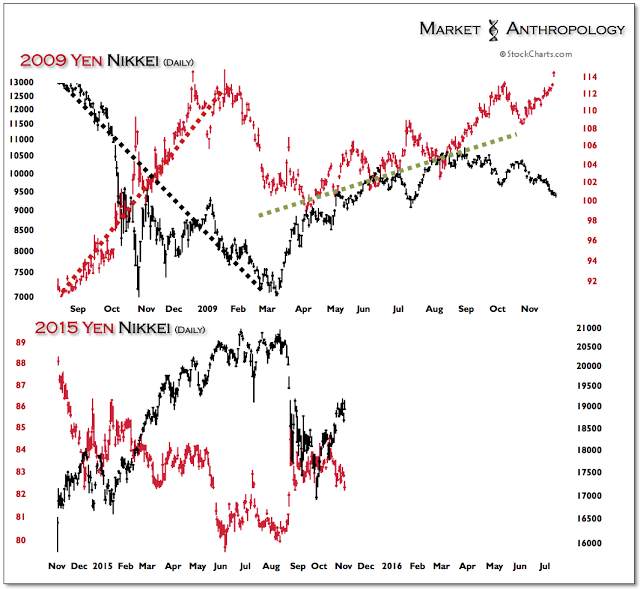
Figure 2: Daily Nikkei 2009 vs Yen 2015

Figure 3: Yen:Nikkei Daily 2009 vs 2015

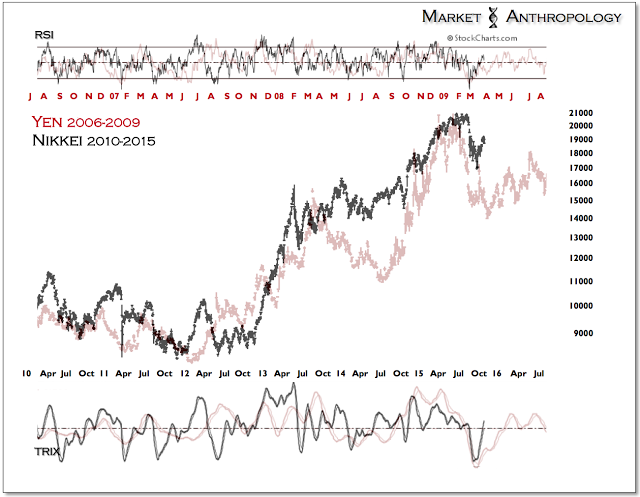
Figure 4: Yen 2006-2009:Nikkei 2010-2015

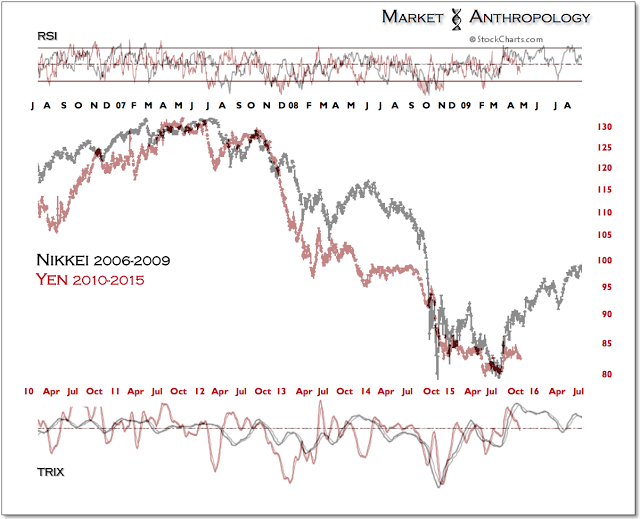
Figure 5: Nikkei 2006-2009:Yen 2010-2015

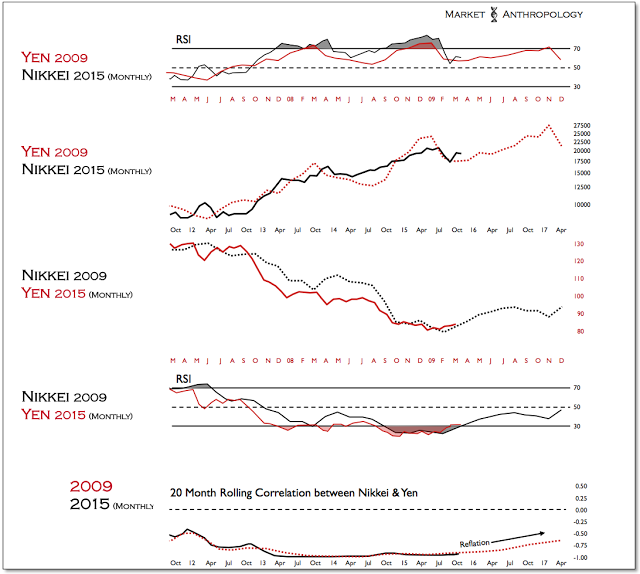
Figure 6: Monthly Yen 2009:Nikkei 2015 vs Nikkei 2009:Yen 2015

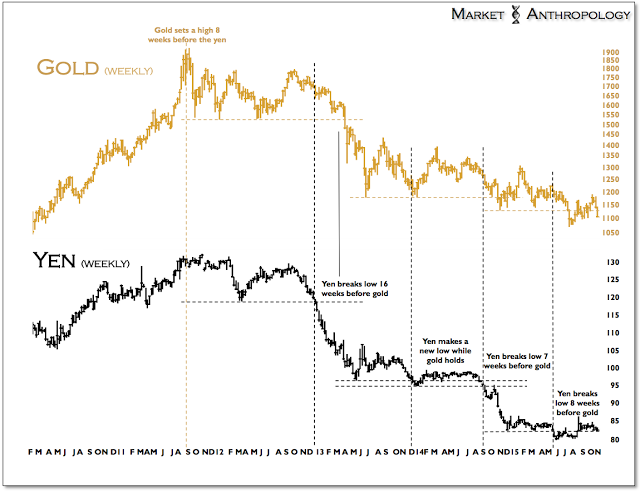
Figure 7: Gold:Yen Weekly 2010-2015

Along with the yen's retracement over the past few weeks, gold has given back all of its gains for October. Should the yen break down again from previous support it currently resides on, we would expect new lows for gold to follow. All things considered, we like the yen's prospects here and expect gold to also firm.

Moreover, one of the best proxies that we've found for reflationary moves - the silver:gold ratio, is beginning to display a rare, long-term momentum reversal. We often use TRIX as a simple visual momentum signature in our comparatives, because of its great ability to smooth out the noise and frame the bigger picture - as well as its capability as a forward indicator.

As we've mentioned over the years in previous notes, the silver-gold ratio has also been an excellent leading indicator in the past for the broader health of the precious metals sector and inflation expectations, as silver acts as the higher beta asset more susceptible to risk aversion in disinflationary market environments, or conversely - exhibits greater returns in reflationary conditions.

Although expectations of inflation have been clearly misplaced over the years, the signal line crossover now taking place in the ratio bodes well for the broader precious metals sector heading into 2016, as well as other assets closely tied to rising inflation expectations such as oil.
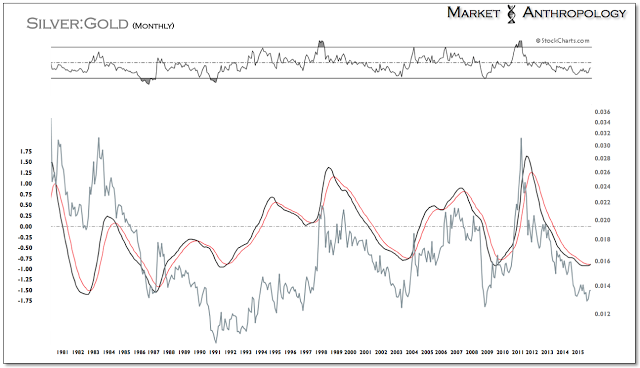
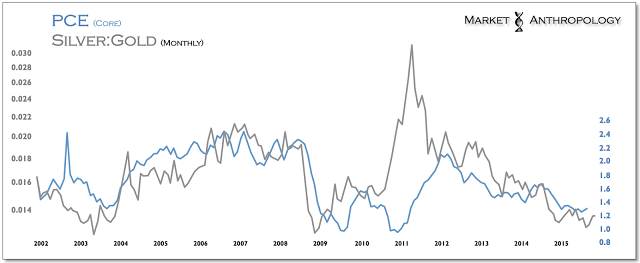
Figure 8: Silver:Gold Monthly 1981-2015

Figure 9: Core PCE vs Silver:Gold Monthly 2002-2015

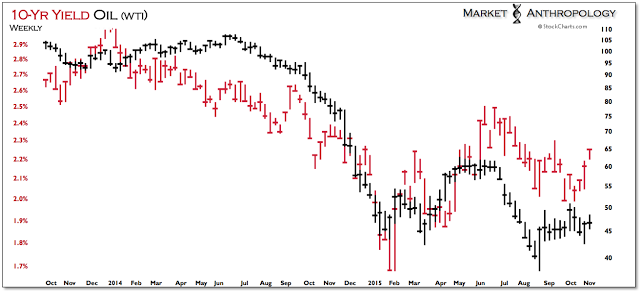
Figure 10: Weekly 10-Y Yield:Oil 2013-2015

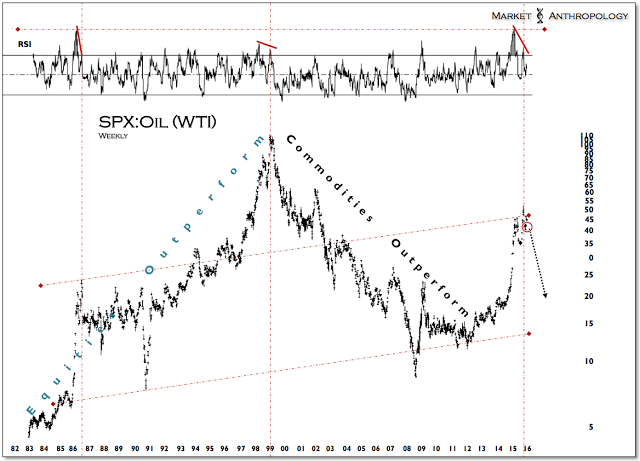
Figure 11: SPX:Oil Weekly 1982-2015

Latest comments

Loading next article…
Risk Disclosure: Trading in financial instruments and/or cryptocurrencies involves high risks including the risk of losing some, or all, of your investment amount, and may not be suitable for all investors. Prices of cryptocurrencies are extremely volatile and may be affected by external factors such as financial, regulatory or political events. Trading on margin increases the financial risks.
Before deciding to trade in financial instrument or cryptocurrencies you should be fully informed of the risks and costs associated with trading the financial markets, carefully consider your investment objectives, level of experience, and risk appetite, and seek professional advice where needed.
Fusion Media would like to remind you that the data contained in this website is not necessarily real-time nor accurate. The data and prices on the website are not necessarily provided by any market or exchange, but may be provided by market makers, and so prices may not be accurate and may differ from the actual price at any given market, meaning prices are indicative and not appropriate for trading purposes. Fusion Media and any provider of the data contained in this website will not accept liability for any loss or damage as a result of your trading, or your reliance on the information contained within this website.
It is prohibited to use, store, reproduce, display, modify, transmit or distribute the data contained in this website without the explicit prior written permission of Fusion Media and/or the data provider. All intellectual property rights are reserved by the providers and/or the exchange providing the data contained in this website.
Fusion Media may be compensated by the advertisers that appear on the website, based on your interaction with the advertisements or advertisers.
© 2007-2025 - Fusion Media Limited. All Rights Reserved.