- Russell 2000 seems to be leading the charge higher for US indexes.
- The index is breaking out of a triangle pattern, with more gains likely.
- In this article, we will analyze how to trade this opportunity.
- Unlock AI-powered Stock Picks for Under $8/Month: Summer Sale Starts Now!
While the larger-cap indexes Nasdaq and S&P 500 fight to regain their all-time highs after Friday's selloff, a larger rotation could be bubbling below the surface.
Over the last few sessions, the Russell 2000 index posted a clean and decisive technical breakout in all timeframes and now looks poised to keep on gaining.
The trend is fundamentally buoyed by rising expectations of a Fed rate cut in September combined with increasingly widening PE ratios between large and small caps. On the technical side, the stars seem aligned for the small-cap index as well, with a near 10% post-breakout gains appearing the most likely path forward in the short term.
Let's delve into the current numbers to understand how to capitalize on this trading opportunity.
Russell 2000: Key Levels to Watch
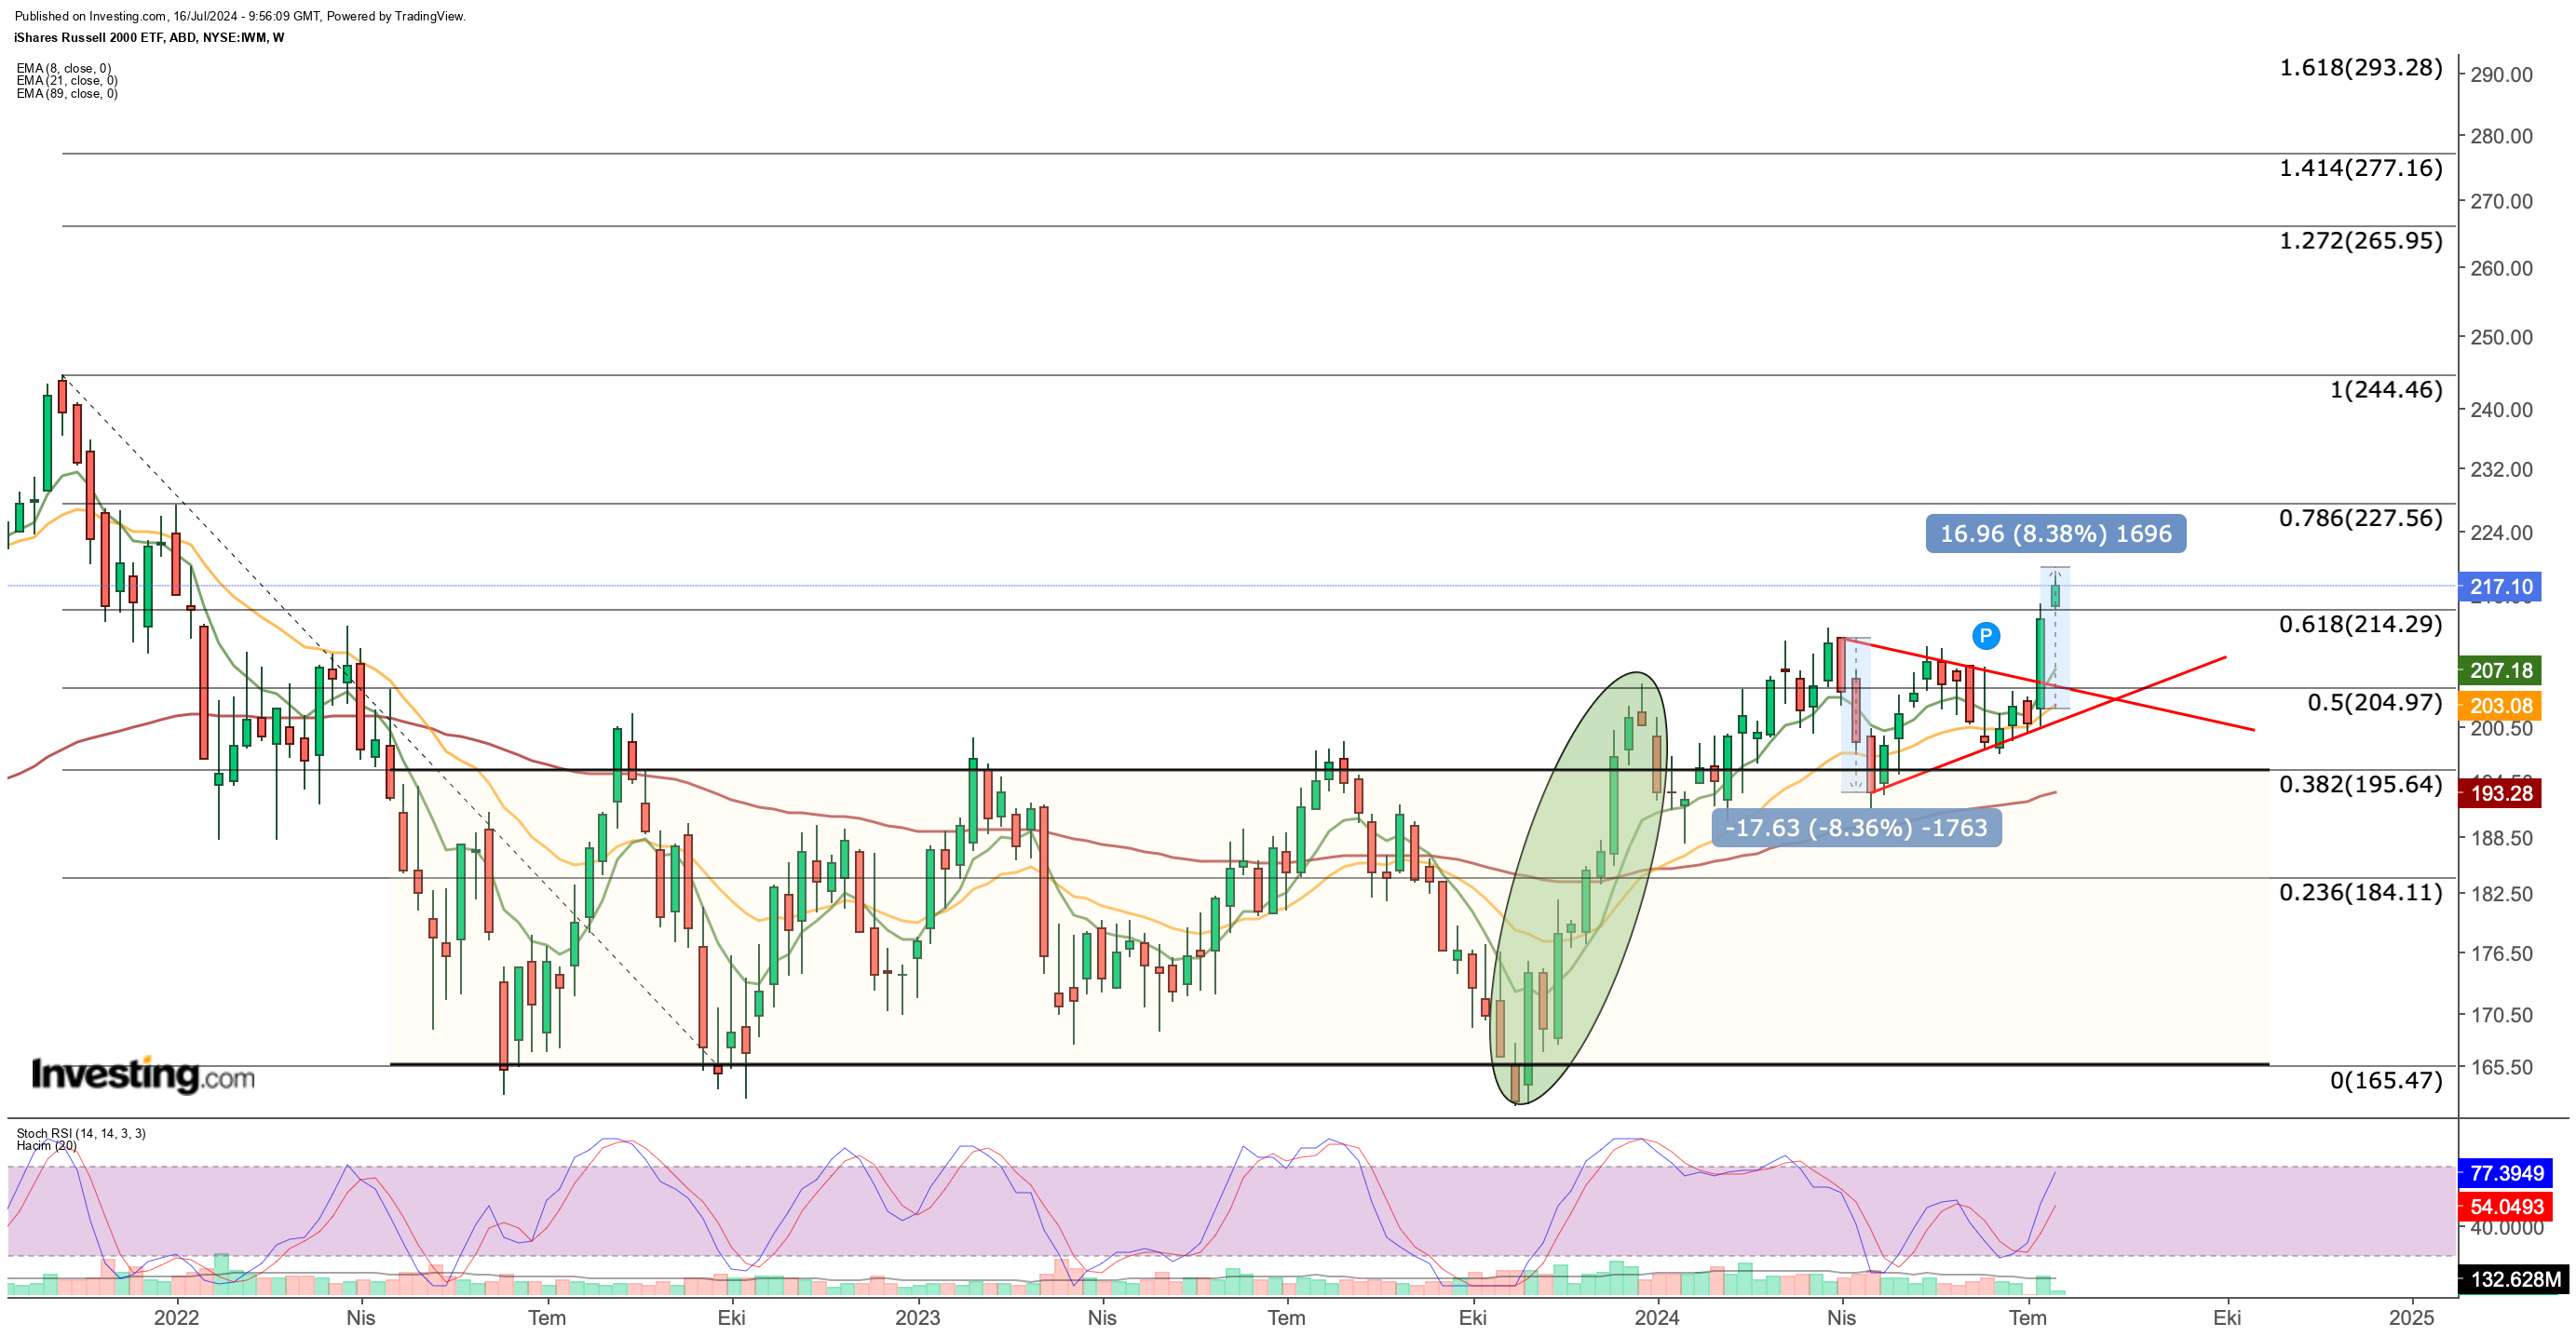
A detailed analysis of the iShares Russell 2000 ETF (NYSE:IWM), which tracks the index, reveals a symmetrical triangle pattern forming from April to July, now breaking out to the upside.
This pattern suggests potential gains of around 8.5% post-breakout based on the size of the symmetrical triangle, indicating promising upside potential from current levels.

Resistance around 220 may present a challenge. If the index struggles at these levels, it could retreat to test support levels in the days ahead.
Looking at the long-term outlook, the initial support at 214 (Fib 0.618) could come into play. A break below this support could extend the retracement towards the 204 region, coinciding with the upper boundary of the symmetrical triangle.
However, yesterday's bullish momentum resulted in a clear daily candle closing above the Fib 0.618 resistance, supported by positive movements in several technical indicators. On the weekly chart, the Stochastic RSI has sharply turned upwards, signaling increasing momentum. Additionally, medium-term EMA values are showing positive signals.
With these developments, while the 220 level may act as intermediate resistance, surpassing it could propel the index towards 227 and then 244, the peak seen in 2021. According to long-term Fibonacci levels, further targets could extend into the 265-290 range.
The current upward movement is bolstered by expectations that Fed rate cuts will particularly benefit small-cap companies, potentially sustaining the trend's strength. Notably, the Russell 2000 index saw significant gains towards the end of last year, spurred by speculation of multiple rate cuts in 2024. From its October 2023 low to early this year, the index surged by more than 25%, as illustrated on the weekly chart.
Potential Pullbacks in the Russell 2000 Index: A Buying Opportunity?
The Russell 2000 index, which followed a volatile course in 2024, offers a potential buying opportunity amid pullbacks. This volatility stems from uncertainties about the US economy. However, last week's 6% jump indicates that economic uncertainty may be waning, and a shift toward policies that accelerate trade is expected.
Given the current outlook, the main trend in the Russell 2000 is likely to remain upward. Investors may view declines as limited, using pullbacks as buying opportunities to capitalize on the anticipated economic policies.
***
This summer, get exclusive discounts on our subscriptions, including annual plans for less than $8 a month!
Are you tired of watching the big players rake in profits while you're left on the sidelines?
InvestingPro's revolutionary AI tool, ProPicks, puts the power of Wall Street's secret weapon - AI-powered stock selection - at YOUR fingertips!
Don't miss this limited-time offer.
Subscribe to InvestingPro today and take your investing game to the next level!
Disclaimer: This article is written for informational purposes only; it does not constitute a solicitation, offer, advice, counsel or recommendation to invest as such it is not intended to incentivize the purchase of assets in any way. I would like to remind you that any type of asset, is evaluated from multiple perspectives and is highly risky and therefore, any investment decision and the associated risk remains with the investor.

