- S&P 500's recent bounce may have room to run.
- However, longs should be aware of key resistance zones that may trigger selling.
- In this piece, we'll discuss those levels alongside a technical view of the German Dax.
- For less than $8 a month, InvestingPro's Fair Value tool helps you find which stocks to hold and which to dump at the click of a button.
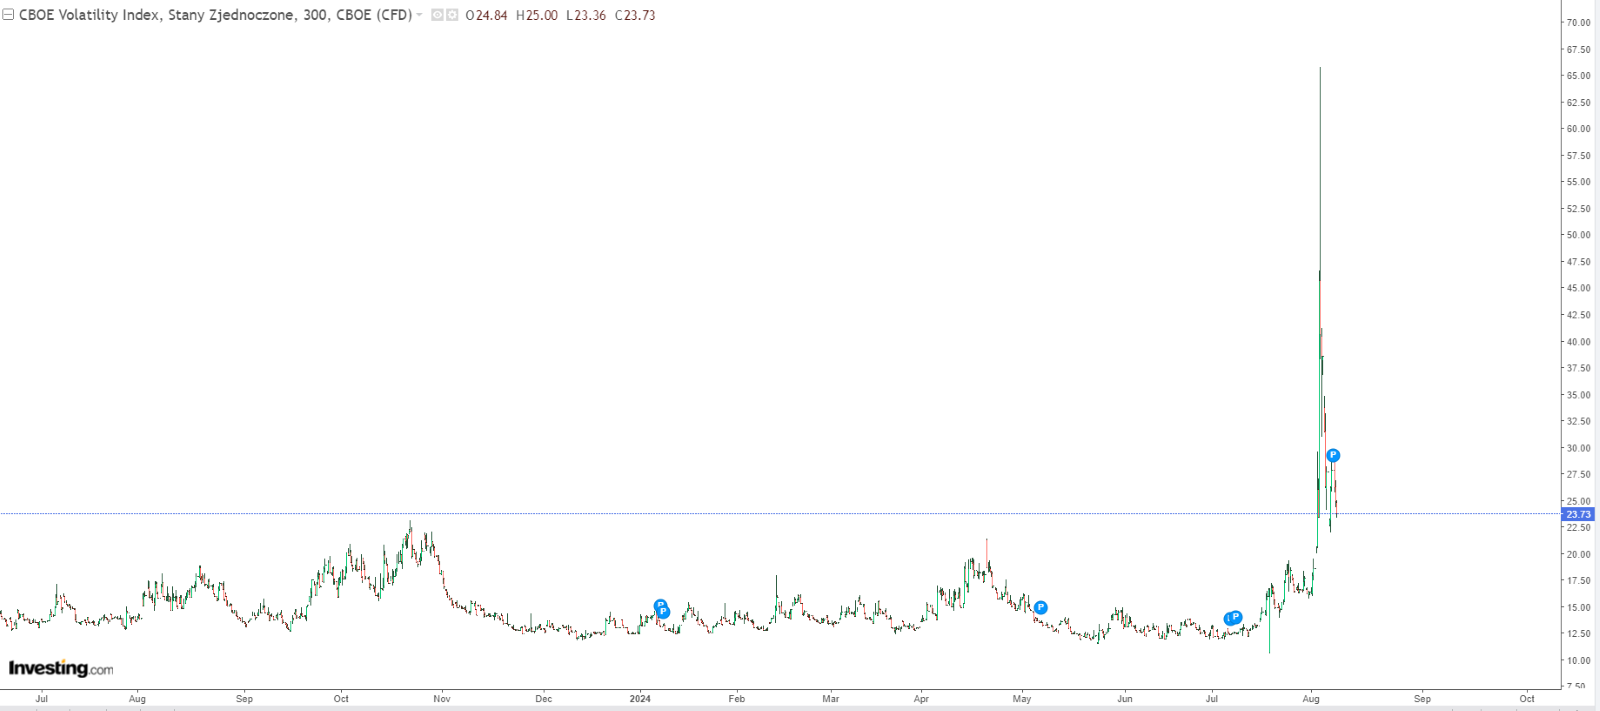
The S&P 500 has had a roller-coaster week. This was underscored by the VIX, which first surged by 65%, marking its second-largest daily gain ever, only to plummet by 41% shortly afterward, the largest drop in its history

This extreme volatility was an indication of investors' anxiety about the economy, which seemed to be slowing down faster than anticipated.
But yesterday's jobless claims data bought some respite for the bulls as key indexes bounced back with both the Nasdaq and S&P 500 gaining over 2% each.
The larger-than-expected drop in the jobless claims for the latest week eased concerns about a rapid deterioration in the labor market.
Every sector in the S&P 500 saw an increase, with technology and communication services leading the charge. Small-cap stocks also saw notable gains, with the Russell 2000 index rising by 2.4%.
With this backdrop, let’s analyze the technical outlook for the S&P 500 and assess what the charts might reveal about the trading session ahead.
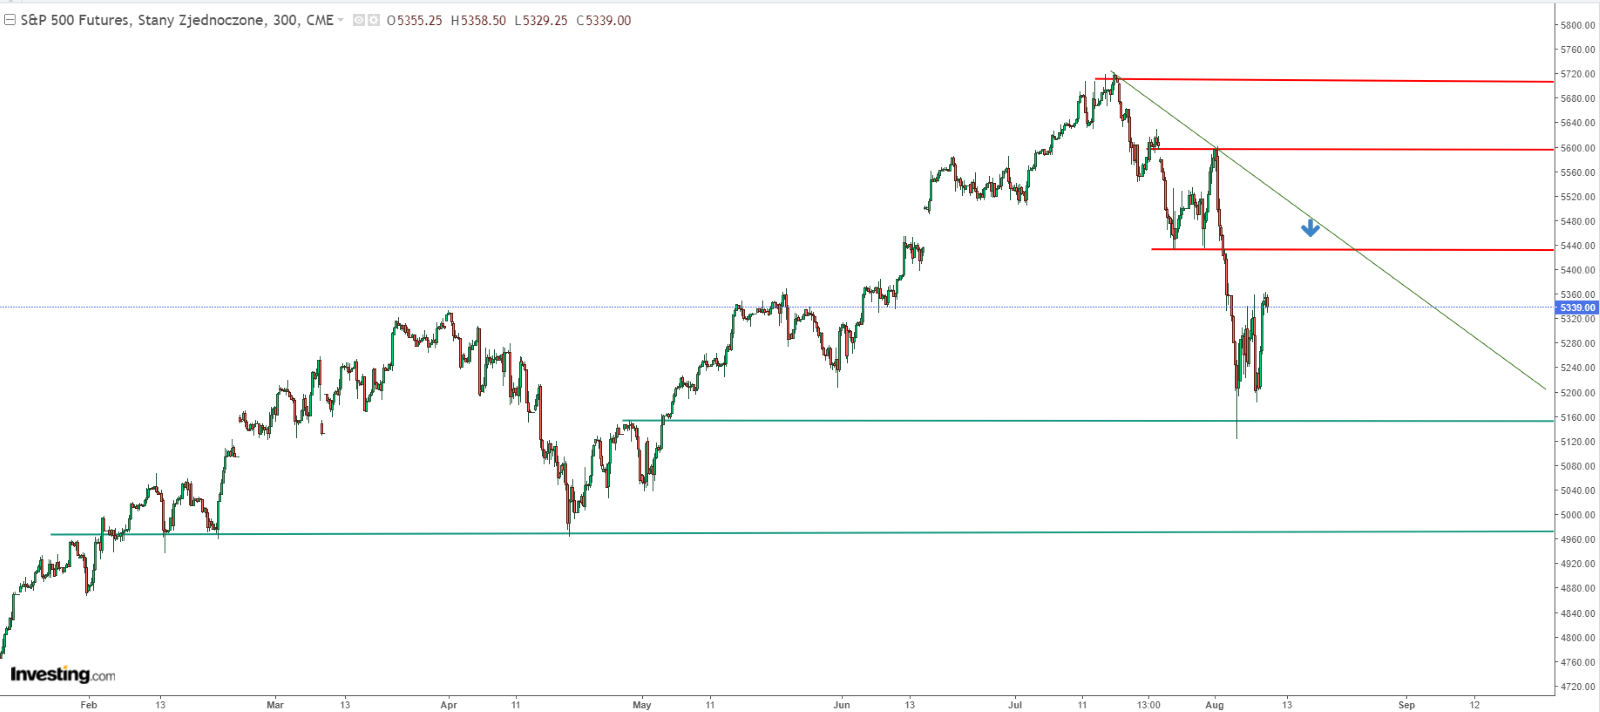
S&P 500: Bears Lurk at 5,600
From a technical standpoint, the S&P 500 has gained traction after consolidating on Tuesday. However, the bulls face several technical challenges if the rally is to be sustained.
The index's recent rebound shows that bears are challenging bulls and hindering their ability to drive growth freely.
Despite this, yesterday's demand managed to counteract the recent supply surge and maintain the upward momentum. The immediate target now stands at 5450 points, where a local downtrend line confirms this level.

For those holding long positions, it's crucial to monitor the strong supply zone around 5600 points. This area, which sparked the latest downward wave, indicates that supply remains significant and bears remain active.
Dax: Technical View
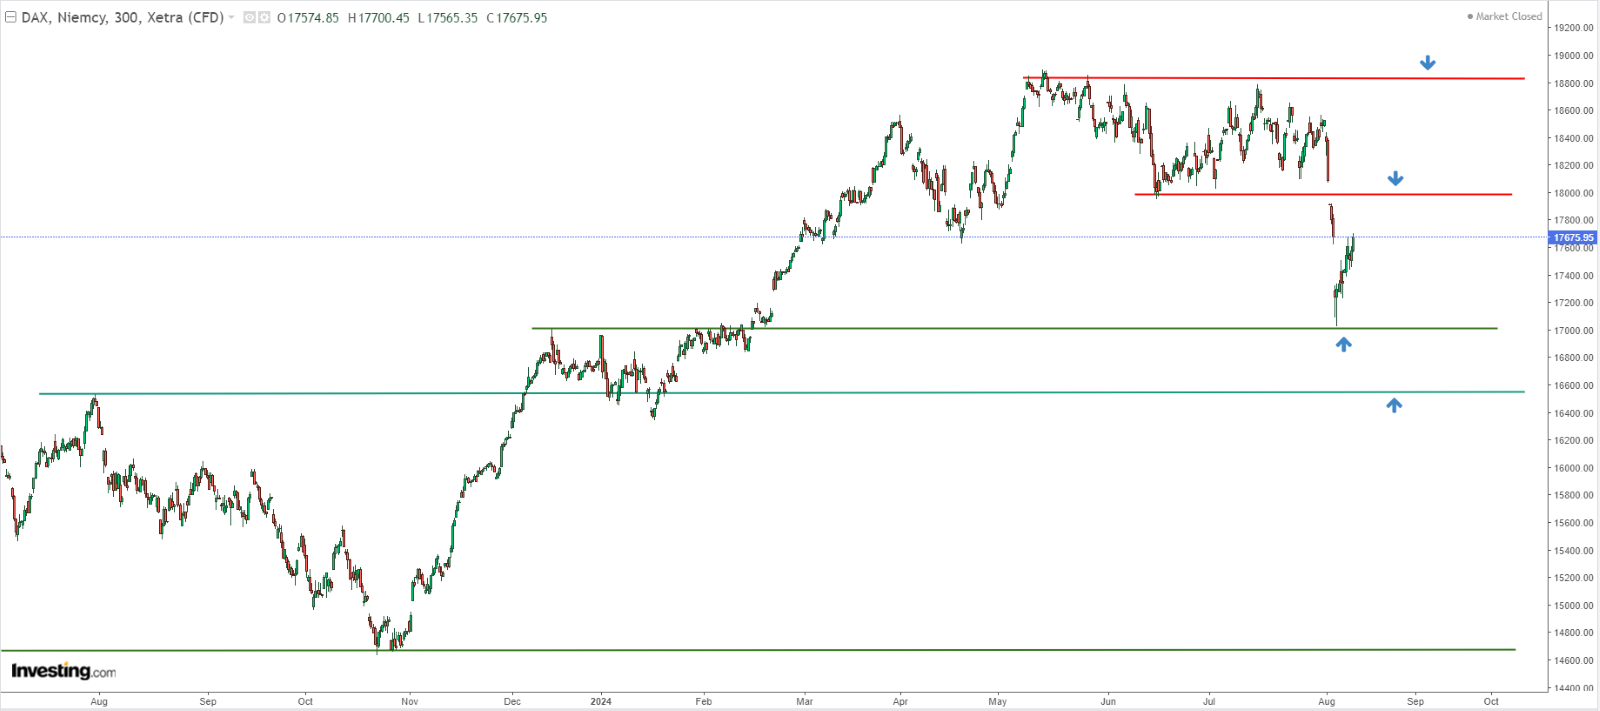
The recent US macroeconomic data has significantly impacted global stock markets, including the German DAX. The bulls are making a strong comeback, nearing the critical resistance level of 18,000 points.

This resistance level represents a crucial barrier. A breakthrough could set the stage for a push towards recent historical highs just below 19,000 points. Conversely, bears attempting to extend the decline will likely face increased resistance around 16,600 points.
***
This summer, get exclusive discounts on our subscriptions, including annual plans for less than $8 a month.
Try InvestingPro today and take your investing game to the next level.

Disclaimer: This article is written for informational purposes only; it does not constitute a solicitation, offer, advice, or recommendation to invest and is not intended to incentivize asset purchases in any way. I would like to remind you that any type of asset is evaluated from multiple perspectives and is highly risky; therefore, any investment decision and associated risk remains with the investor.
