
- US index futures are up as the S&P 500 looks to open the session on a bullish note.
- The S&P 500's rally faces overbought conditions, with support levels and key resistance points in focus.
- As the index looks to extend its winning streak, watch for a break above 5,500 key resistance for a continued uptrend.
- For less than $8 a month, InvestingPro's Fair Value tool helps you find which stocks to hold and which to dump at the click of a button.
US index futures are on the rise ahead of the market open as stronger-than-expected July retail sales signal resilient consumer spending ahead of the Federal Reserve’s meeting next month. Meanwhile, a drop in new unemployment claims last week indicated that a gradual softening of the labor market remains intact.
These developments come after the S&P 500 notched its fifth consecutive gain on Wednesday, with a modest rise following Tuesday’s strong performance. Investors welcomed softer inflation data, which strengthened expectations for a potential rate cut by the Fed in September.
While disinflation trends are encouraging, investors are left wondering how the economy will react to these anticipated rate cuts and if a hard landing can be avoided. Current macroeconomic indicators suggest a weakening global economy, which could theoretically hurt corporate profits.
However, after the market's impressive recovery over the past week and a half, bearish traders may need to wait for a clear sell signal before considering short positions. On the other hand, bullish investors are likely to buy on short-term dips unless key support levels start to falter, some of which will be highlighted in this article.
Balancing Optimism Over Rate Cuts with Growth Concerns
Following the release of July's US consumer inflation data, major equity indices on Wall Street saw gains, though small-cap stocks underperformed. The lack of a more significant rally can be attributed to the fact that investors had already anticipated weaker inflation, having positioned themselves with long-risk and short-dollar trades following the release of softer producer price data the previous day.
Although the Consumer Price Index (CPI) met analysts' expectations, it wasn’t weak enough to prevent some profit-taking on short dollar trades, tempering risk appetite in equities. Despite this, the disinflation process continues, with CPI inflation falling below 3.0% for the first time since March 2021. This weaker inflation data could pave the way for the first rate cut since 2020. The critical question remains whether the Federal Reserve will opt for a 25 or 50 basis point cut in September, and at what pace they will proceed thereafter.
With that in mind, let's take a look at the key technical levels to watch out for in the S&P 500.
S&P 500 Technical Analysis and Trading Ideas
After a 5-day rally, the S&P 500 futures chart appears somewhat overstretched and overbought on short-term time frames. However, this doesn’t necessarily indicate an imminent sell-off. A period of sideways movement could allow the market to consolidate and work off these overbought conditions. The S&P 500's recent reclaiming of the shaded blue zone between 5333 and 5396 is a positive sign for bulls. As long as this area holds, any short-term dips could offer viable dip-buying opportunities.
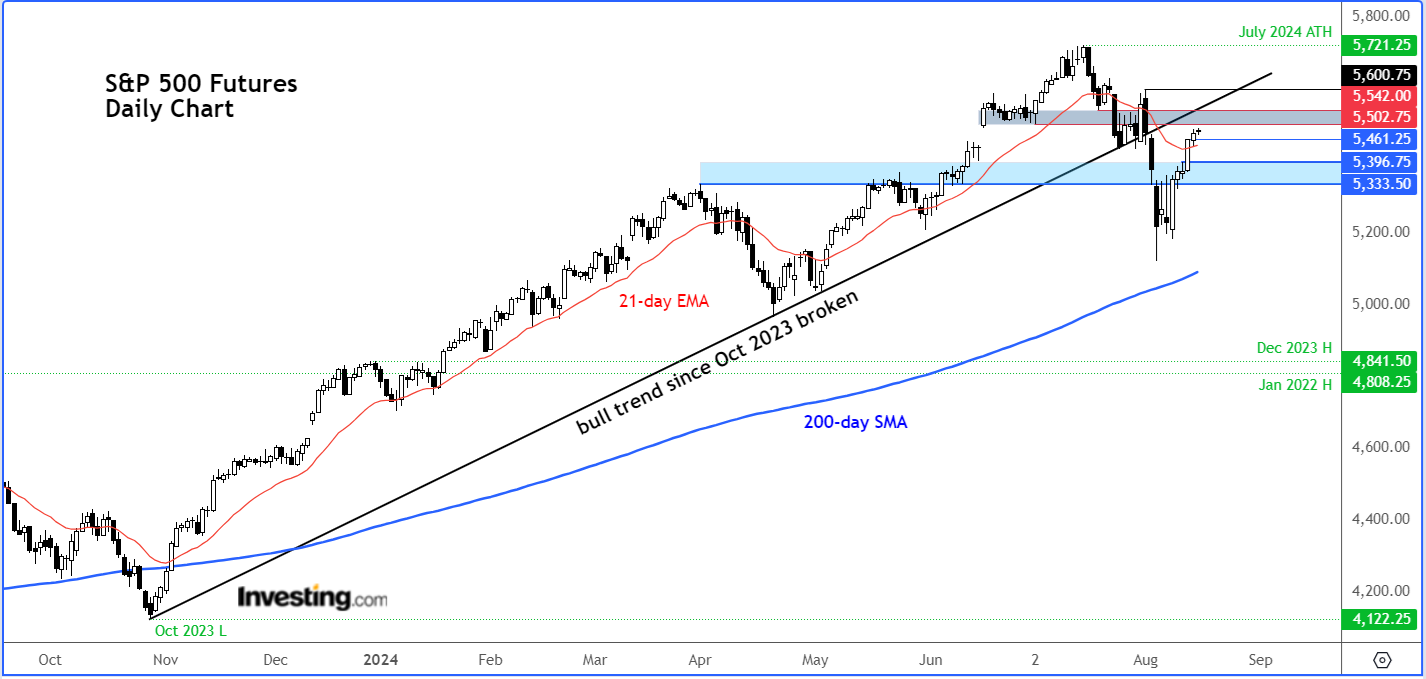
In terms of potential resistance levels to watch, we are now approaching a key zone around the 5500 to 5542 range. This area, which previously served as support, now represents the underside of the broken trend line that has been in place since October 2023. Bearish traders will be closely watching for any signs of weakness here; however, a decisive break above this resistance could send a strong bullish signal, potentially propelling the index toward new record highs.
***
This summer, get exclusive discounts on our subscriptions, including annual plans for less than $8 a month.
Try InvestingPro today and take your investing game to the next level.

Disclaimer: This article is written for informational purposes only; it does not constitute a solicitation, offer, advice, counsel or recommendation to invest as such it is not intended to incentivize the purchase of assets in any way. I would like to remind you that any type of asset, is evaluated from multiple perspectives and is highly risky and therefore, any investment decision and the associated risk remains with the investor.
Read my articles at City Index
Which stock should you buy in your very next trade?
With valuations skyrocketing in 2024, many investors are uneasy putting more money into stocks. Unsure where to invest next? Get access to our proven portfolios and discover high-potential opportunities.
In 2024 alone, ProPicks AI identified 2 stocks that surged over 150%, 4 additional stocks that leaped over 30%, and 3 more that climbed over 25%. That's an impressive track record.
With portfolios tailored for Dow stocks, S&P stocks, Tech stocks, and Mid Cap stocks, you can explore various wealth-building strategies.