
-
The S&P 500’s recent drop signals a potential shift, with key earnings results expected to influence any recovery.
-
Disappointing tech earnings, especially from Alphabet, have driven the market down, raising concerns about further declines.
-
Technically, the S&P 500 index may find support near 5,435 or 5,542 levels, but bulls will need to show up to spark a bounce.
-
Unlock AI-powered Stock Picks for Under $8/Month: Summer Sale Starts Now!
European and Asian shares fell sharply following Wall Street's decline on Wednesday. US index futures also point to a weaker open on Wall Street.
Although a short-term rebound is possible, the recent technical damage means that any recovery will need strong earnings results to sustain momentum. Without this, further selling could occur near broken support levels, especially given the market's recent exhaustion during the bull trend.
This correction presents an excellent opportunity to buy high-quality stocks that may now be undervalued. ProPicks, our advanced AI tool, can help you navigate this opportunity effectively. Instead of scrambling to identify the best stocks to buy, let ProPicks guide you with precision.
Our cutting-edge AI evaluates fundamental data to identify over 90 high-potential stocks each month before they rise. This AI tool can help you capitalize on market corrections and maximize your portfolio gains.
Additionally, you'll gain access to proven portfolio strategies that have outperformed the S&P 500 by more than double this year.
So don't wait any longer, turbocharge your portfolio today!
Want to check out all the picks for the Q2 earnings season? Subscribe now for less than $8 a month as part of our summer sale and start beating the market today!
Why have stocks tumbled this week?
After such a strong rally in the first half of this year, it was always going to be difficult to sustain that momentum, especially as we hadn’t seen any big retracement in that uptrend. Markets had clearly gotten ahead of themselves, especially in the technology sector.
And while we have seen evidence of rotation in other sectors like energy and financials in the previous week, this wasn’t strong enough to prevent the wider market from going down along with the tech sector – not when the first of the "Magnificent 7" companies reporting results that failed to meet expectations.
Indeed, the general consensus had been quite optimistic for this earnings season, with surveys indicating that investors expect company results to fuel the next phase of the equity rally. According to FactSet, the Magnificent 7 companies were anticipated to significantly boost S&P 500 earnings for the second quarter.
Four of these companies — Nvidia Corporation (NASDAQ:NVDA), Amazon (NASDAQ:AMZN), Meta (NASDAQ:META), and Alphabet (NASDAQ:GOOG) (NASDAQ:GOOGL) - are/were expected to be among the top five contributors to the S&P 500's year-over-year earnings growth for Q2 2024.
Therefore, with Alphabet (and Tesla (NASDAQ:TSLA)) disappointing, this has seen investors revise their expectations somewhat, which is why shares of other stocks in the group of Magnificent 7 have also taken a hit.
Investors fear that companies, as exemplified by Alphabet, are spending far more on AI development to outmatch rivals in this field than expected. They are starting to recognise that all the money being poured into AI is more of a cost at the moment, rather than something that's bringing in revenue.
While that could change in the long run, as growth stocks are by definition valued so highly because of future profits anyway, in the short term the mismatch in actual results from expectations is starting to worry some investors. It will be interesting to see how other companies in the Magnificent 7 group will perform when they release their results, with most coming in next week.
S&P records first 2% drop in this bull trend but will dip buyers step back in?
On Wednesday, Wall Street investors further unwound bets on the artificial intelligence frenzy that had powered the US stock market to repeated all-time highs this year. The S&P 500 dropped 2.3%, marking its worst showing since December 2022. This was also the first time we had a 2% drop in this bull trend, which had been one of the longest such stretches ever.
Wednesday’s selling was driven by technology and so the tech-heavy Nasdaq 100 took the brunt of the slump, falling some 3.7% on the session. Its largest constituents were among the biggest losers, such as Alphabet which plunged 5% after its poorly-received earnings results. Other stocks that fell sharply Wednesday include Tesla after its profit missed the mark, while Nvidia (NASDAQ:NVDA), which has been the biggest stocks market influencer this year, plunged nearly 7%.
The pounding these stocks have taken has certainly deflated their valuations somewhat. This might make a case for buying on the dip, but don't get too hasty—the earnings season is just kicking off. Heavyweights like Apple (NASDAQ:AAPL), Microsoft (NASDAQ:MSFT), Amazon.com (NASDAQ:AMZN), and Meta are all set to release their earnings results next week.
In any case, we will need to see a fresh technical “buy” signal on the major indices or specific sectors before getting bullish on stocks again. More on this later, but first…
Can the Fed come to the rescue?
While the stock market sell-off is insignificant when compared to the massive gains made in the last couple of years or so, the sudden drop could hasten the Fed to start cutting rates sooner and more significantly than the market had priced in previously.
Indeed, the US yield curve seeing a sharp steepening means that’s precisely what investors are now anticipating the Fed to do. Swaps traders are factoring in over two quarter-point cuts this year, with the first one baked in for September.
However, with the Fed's next decision just a week away, the push for lower borrowing costs is intensifying and former New York Fed President William Dudley has even suggested that policymakers should cut rates at this upcoming meeting rather than waiting until September. The market is only attaching a 10% probability for a cut at next week’s meeting.
Thus, if the Fed were to cut next week, this would come as a major surprise and could send stocks soaring higher. However, the more likely outcome in my view is that the central bank will use this meeting to prepare the market for a cut in September and potentially one more before the year is out.
S&P 500 technical analysis and trade ideas
Dip-buying has been the trade of 2024. While that strategy could make a return, the size and speed of this week’s drop means that certain rules-based large traders like commodity trading advisers (CTAs) or some algo-driven hedge funds could keep selling stocks if more evidence emerges that the tide has turned.
With that in mind, the bullish trend line that has been in place since October, as can be seen on the S&P 500 futures chart, will need to hold on a daily closing basis around the 5435 area to keep the bulls lurking for fresh dip-buying opportunities.
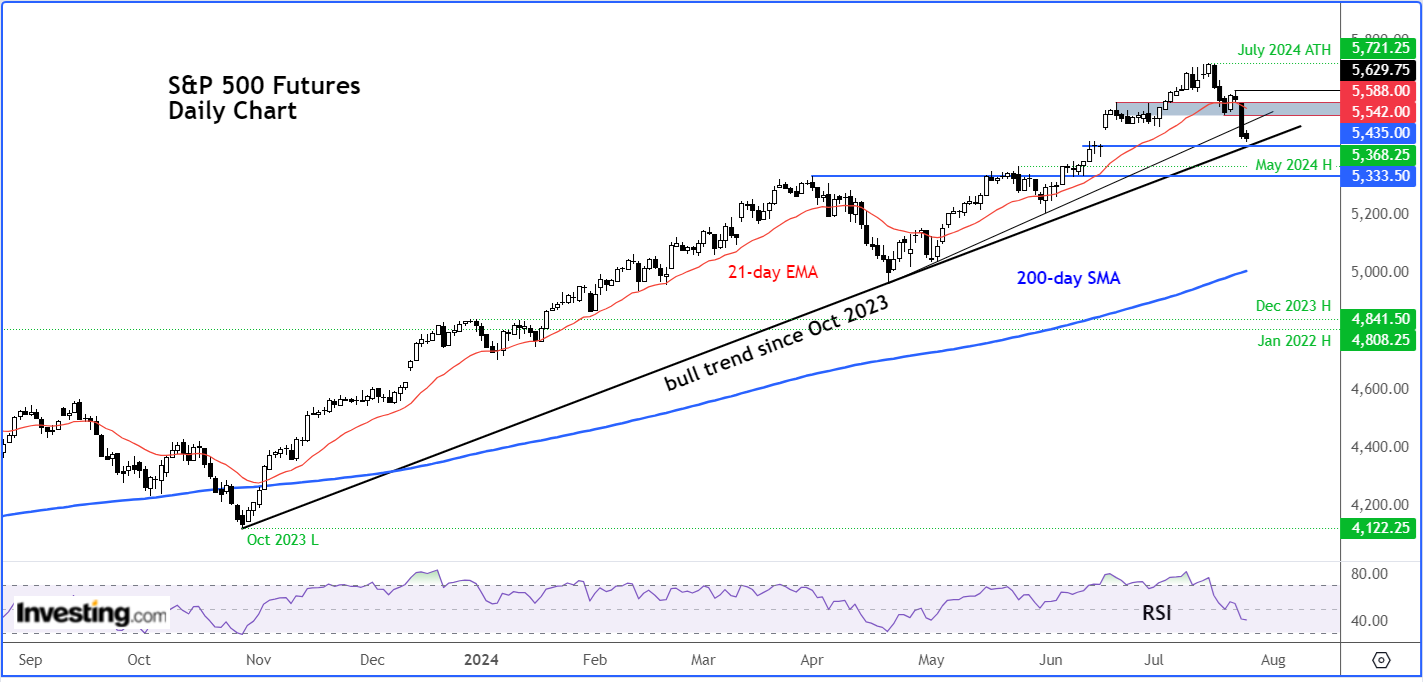
If the trend line holds, we could see at least a short-term bounce towards broken support in the region between 5542 to 5588 area in the coming days, where the potential recovery could then come under some pressure again.
However, if the selling continues, then the next potential support area to watch is the area marking the highs made in April and May between 5333 to 5368. Below that area, there’s not much support seen until long-term support and the 200-day average near the 5,000 mark.
Therefore, the bulls better step up their game near 5435 today or at worst around the 5542-5588 support area in order to prevent a much steeper decline.
In any case, dip buyers will be in need of some confirmation that the market has at least made a temporary low, given extent of the decline this week and the fact that the market is not quite at the oversold levels of 20 on the RSI indicator yet. The RSI was at 20 in at least the last few times when the market bottomed – in October 2022, October 2023 and April 2024.
***
This summer, get exclusive discounts on our subscriptions, including annual plans for less than $8 a month!
Tired of watching the big players rake in profits while you're left on the sidelines?
InvestingPro's revolutionary AI tool, ProPicks, puts the power of Wall Street's secret weapon - AI-powered stock selection - at YOUR fingertips!
Don't miss this limited-time offer.
Subscribe to InvestingPro today and take your investing game to the next level!

Disclaimer: This article is written for informational purposes only; it does not constitute a solicitation, offer, advice, counsel or recommendation to invest as such it is not intended to incentivize the purchase of assets in any way. I would like to remind you that any type of asset, is evaluated from multiple perspectives and is highly risky and therefore, any investment decision and the associated risk remains with the investor.