
- Market's response to the selloff in S&P 500 at the end of last month showcased notable resilience, signaling underlying strength and optimism.
- Despite the historic spike in the VIX and short-term market volatility, long-term trends remain bullish.
- Key indicators suggest that the bullish momentum could continue.
- For less than $8 a month, InvestingPro's Fair Value tool helps you find which stocks to hold and which to dump at the click of a button.
The S&P 500's resilience during the selloff at the end of last month was notable, given the severity of the correction. This highlights the underlying strength of the broader market and suggests that investors remain optimistic about the long-term outlook.
Despite the historic spike in the VIX, many sectors managed to remain above the golden cross signal, where the short-term trend (50-day moving average) crosses above the long-term trend (200-day moving average).
Throughout that correction, the market and breadth readings held up remarkably well. This resilience is notable given that we saw the third-largest spike in the fear index during a roughly 9% correction.

In hindsight, this correction proved to be a strong buying opportunity. It highlights the benefit of maintaining a long-term perspective. Over a five-year horizon, investing in the stock market has generally been rewarding. From 1926 to the present, the S&P 500’s five-year returns have been positive 88% of the time.
However, it’s crucial to remember that even with this positive long-term trend, there have been periods of significant decline, with five-year performance dropping between -29% and -61%. This serves as a reminder of the high risk associated with shorter investment horizons.
Here’s a breakdown of annual trends on short to medium-term horizons:
- 1 year: 75% bullish trend, 25% bearish trend
- 2 years: 83% bullish trend, 17% bearish trend
- 3 years: 84% bullish trend, 16% bearish trend
- 4 years: 86% bullish trend, 14% bearish trend
- 5 years: 88% bullish trend, 12% bearish trend
The data clearly show that the odds of positive returns are in our favor, with potential losses increasing the shorter the time horizon. Short-term views can add unnecessary stress to our investment process, often leading to incomplete perspectives.
Currently, the market favors the bulls, and the long-term bullish trend remains strong. A key factor supporting this trend is the robust credit appetite, with US junk corporate bond yields reaching their lowest levels in two years.
Bonds Support Bullish Outlook
Despite recession worries, corporate bond yield spreads, which typically widen before and during recessions, are not signaling an impending downturn.

This stands in contrast to the inverted yield curve, which has been hinting at a possible recession for nearly two years. High-yield bonds, which come from less stable, troubled companies, are usually the first to be sold off during times of fear and volatility.

Currently, as we are in a recovery phase, the ratio of high-yield bonds (NYSE:HYG) to U.S. Treasury bonds (NASDAQ:IEI) has bounced back from previous highs, similar to the period when stocks hit their October 2022 bottom.
This bounce supports a bullish outlook, as the spread still shows a clear upward trend favoring high yields and higher risk, with increased selling of U.S. Treasury bonds. We’ve transitioned from a fear phase, where the ratio favored U.S. Treasury bonds, to a bullish signal as the ratio recovers to the 0.66 level, similar to January 2024 levels.
A rise above 0.67 could further increase the likelihood of new highs for stocks. However, if the ratio falls back below these levels, it might signal new declines and potential lows.
S&P 500 P/E to VIX - A Key Relationship to Monitor
Another key aspect to consider is the relationship between the S&P 500’s P/E ratio and the volatility index. Recently, a high P/E ratio, like the one we’ve seen, often precedes significant corrections or the onset of bear markets.
Specifically, when the P/E ratio approaches or exceeds 2, major declines have typically followed over the past four years.

Currently, after a sharp rise last year, the ratio is nearing the average "stress" level. Historically, if this level persists, it could support a continuation of the bullish trend. Returning to averages, a decrease in golden cross signals would suggest a higher risk of a severe correction.
Majority of Stocks Remain in a Bullish Trend
Presently, about two-thirds of stocks are in a long-term bullish trend above the 50- and 200-day moving averages. Medium-term levels show 74.15% above the 200-day and 71.37% above the 50-day averages. Historically, percentages above 60% have indicated a strong uptrend, with high breadth being a positive sign for the index's continued bullish trend.
A drop below 55%-50% in these averages could raise concerns among investors, but currently, the market remains in decent shape.
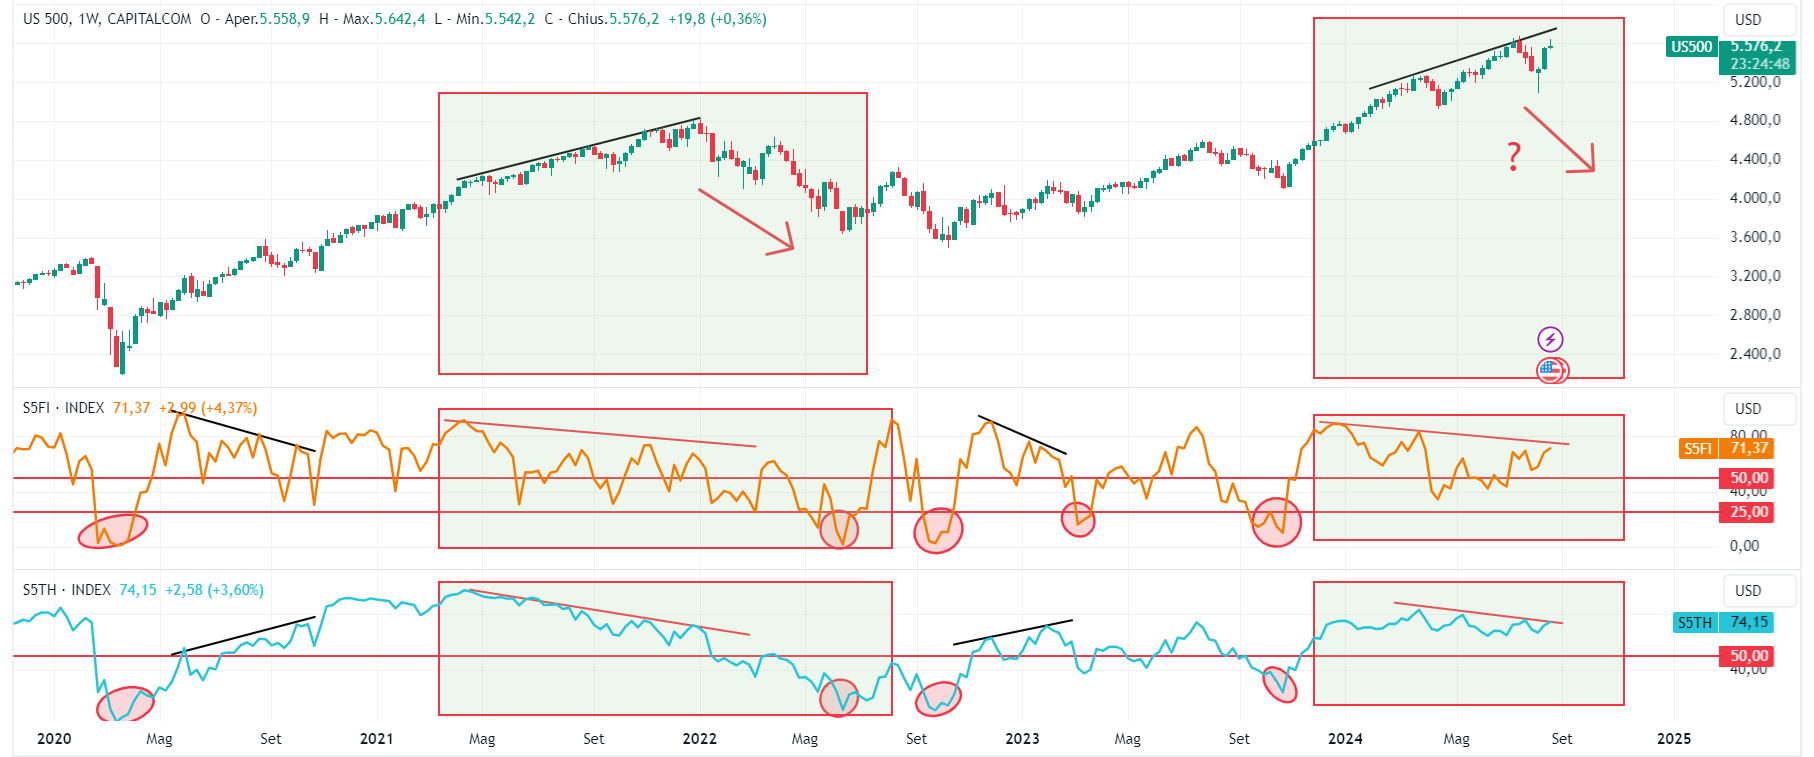
It’s worth noting that double divergences between the S&P 500 Index and the percentage of stocks above moving averages—like we’re seeing now—often predict significant declines followed by strong rebounds.
Bottom Line
In conclusion, we are in a period of sudden market shifts, and it’s easy for investors to lose control during these times. It’s important to remember that despite the market’s volatility, there’s no need to rush decisions.
Stay calm, especially with investments. Historical data provides reassurance: since 1928, the S&P 500 has ended the year positively with a +10% gain or more 55 times.
Even in 23 of those years, there were corrections of at least -10% within the positive year. Moreover, in the same period, equities have experienced 34 years with positive returns of +20% or more, though these years also saw corrections along the way.
***
Disclaimer: This article is written for informational purposes only. It is not intended to encourage the purchase of assets in any way, nor does it constitute a solicitation, offer, recommendation or suggestion to invest. I would like to remind you that all assets are evaluated from multiple perspectives and are highly risky, so any investment decision and the associated risk is at the investor's own risk. We also do not provide any investment advisory services. We will never contact you to offer investment or advisory services.