
- Tech stocks tumbled after chip sales restrictions to China, but the broader market remains positive.
- Focus shifts to Netflix earnings after the close, with key metrics and subscriber growth in the spotlight.
- While tech struggles, the Dow surges and energy/financials shine, suggesting sector rotation and continued upside for the broader market.
- Unlock AI-powered Stock Picks for Under $8/Month: Summer Sale Starts Now!
Sentiment in the tech sector took a hit on Wednesday as tighter US chip sales restrictions to China triggered a sell-off. The Nasdaq had its worst day since 2022, but index futures have since tried to rebound after Taiwan Semiconductor Manufacturing (NYSE:TSM), which supplies chips to Apple (NASDAQ:AAPL) and Nvidia (NASDAQ:NVDA), reported earnings that exceeded analyst expectations and raised its full-year revenue growth forecast.
The focus will be on Netflix (NASDAQ:NFLX) earnings after the close of play. But while technology shares struggle for a change, the stock market's performance is not solely dependent on the "magnificent 7" group of stocks, even though the sector’s performance will have major implications for tech-heavy indices like the Nasdaq 100.
A good case in point is the Dow Jones Industrial Average reached its fourth record high in as many days on Wednesday, driven by sector rotation, a key theme in recent days.
As tech stocks sell off, a sector rotation is clearly taking hold. This presents a golden opportunity to identify stocks poised for explosive growth.
That's where ProPicks comes in. Our cutting-edge AI analyzes fundamental data to pinpoint 90+ high-potential stocks every month before they take off. ProPicks helps you capitalize on these sector shifts and ride the sector rotation wave to maximize your portfolio gains.
Plus, you will also have access to proven portfolio strategies that have already outperformed the S&P 500 by more than double this year.
Want to check out all the picks for the Q2 earnings season? Subscribe now for less than $8 a month as part of our summer sale and start beating the market today!
It is not all about tech: Energy and financials look quite bullish
While technology shares plunged Wednesday, sending the Nasdaq tumbling, it is worth pointing out that the stock market is not all about the magnificent 7 group of stocks. Indeed, the Dow Jones reached its 4th record high in as many days on Wednesday amid sector rotation.
This has been a key theme in US equities space in recent days. As well as the Dow we have seen some big gains for the small-cap Russell 2000 index. It all started presumably because of the inflation report that was released last week which showed consumer prices falling to 3.0% y/y in June.
Specifically, it has been energy and financials that have benefited while technology stocks have fallen amid rotation into value from growth.
As you can see from the chart of the Financial Select Sector SPDR Fund (NYSE:XLF), the sector staged a breakout after a multi-month consolidation period ended last Friday. Since then, the XLF has continued to rise without looking back.

Similarly, the chart of the Energy Select Sector SPDR Fund (XLE (NYSE:XLE)) shows a breakout from its continuation pattern, specifically a bull flag, moving to the upside.

The Dow chart argues against a top in S&P 500
Given the bullish breakout observed in the above charts and the Dow’s bullish breakout earlier this week, the path of least resistance for the Dow Jones remains upward, which argues against a top being formed on the S&P 500 as these indices tend to go hand in hand.

Having surpassed the key resistance level and the psychological barrier of 40,000, this area will serve as critical support during any future dips on the Dow. Should the index fall below this level, the next key support zone to watch is between 39,450 and 39,680. On the upside, the next target is the Fibonacci-based extension level at 41,366, which represents the 161.8% extension of the last significant decline from the May high.
S&P 500 technical analysis and trade ideas
The S&P 500 chart is still looking quite strong from a technical point of view, as it has been creating higher highs and higher lows without any major hiccups. 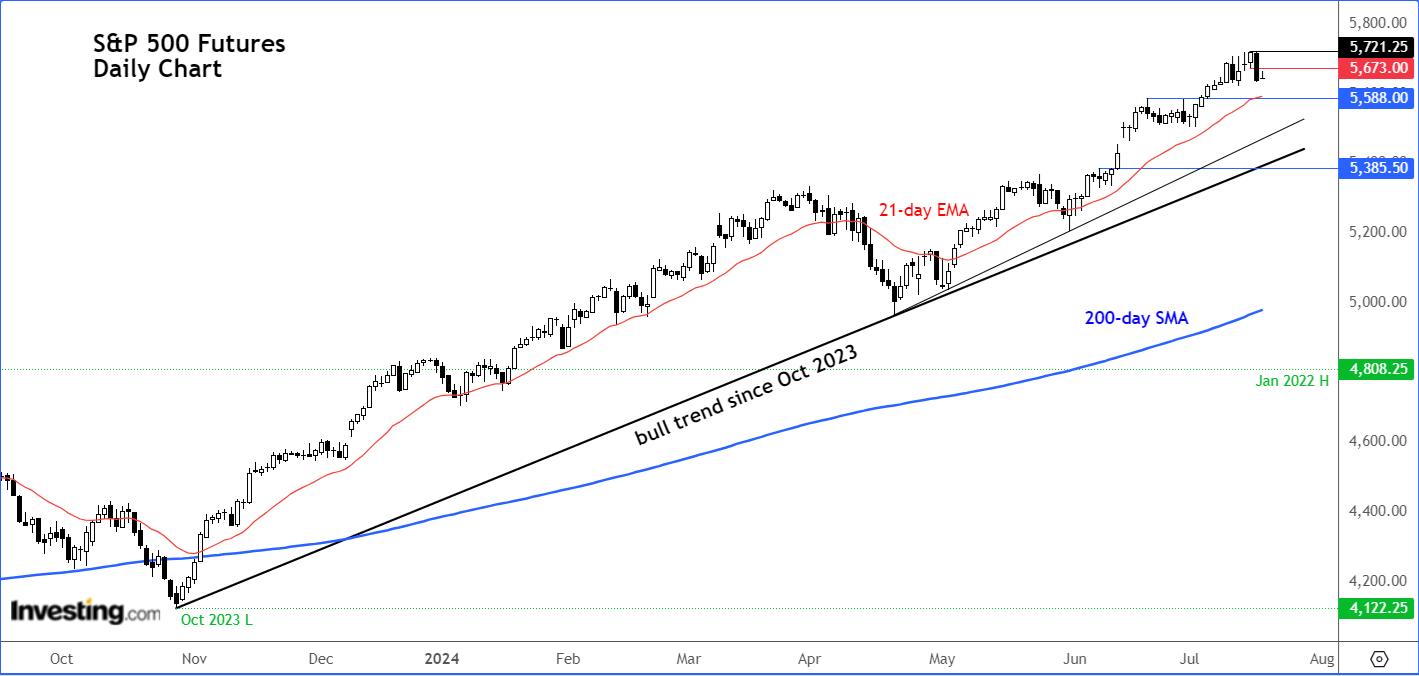
Such strong trends will take time to turn, which should give the bulls plenty of time to get out of trouble on retracements and continue to frustrate the bears with its sharp recoveries every time it looks like the market has topped. For the trend to turn bearish, we will need to see a lower low and a clear reversal pattern.
Neither of which are evident yet on the S&P futures chart. In fact, far from it. The index remains above key short-term support and a 21-day exponential moving average of around 5,588. Below this area, you have 5,500 support where a short-term trend line comes into play.
Then the bullish trend line that has been in place since October 2023 will come into focus. In other words, many levels could potentially provide support should we see some downside follow-through after Wednesday’s tech-driven sell-off.
In a nutshell
Therefore, despite the tech slump, sentiment towards US stocks remains positive due to confidence that the Federal Reserve will cut rates. However, the tech sector no longer seems valuable at its current high levels. Historically, corrections like the one seen this week in the tech sector have been quickly bought up. Therefore, it wouldn't be surprising to see another round of dip-buying in the sector once profit-taking pressure eases.
***
This summer, get exclusive discounts on our subscriptions, including annual plans for less than $8 a month!
Tired of watching the big players rake in profits while you're left on the sidelines?
InvestingPro's revolutionary AI tool, ProPicks, puts the power of Wall Street's secret weapon - AI-powered stock selection - at YOUR fingertips!
Don't miss this limited-time offer.
Subscribe to InvestingPro today and take your investing game to the next level!

Disclaimer: This article is written for informational purposes only; it does not constitute a solicitation, offer, advice, counsel or recommendation to invest as such it is not intended to incentivize the purchase of assets in any way. I would like to remind you that any type of asset, is evaluated from multiple perspectives and is highly risky and therefore, any investment decision and the associated risk remains with the investor.