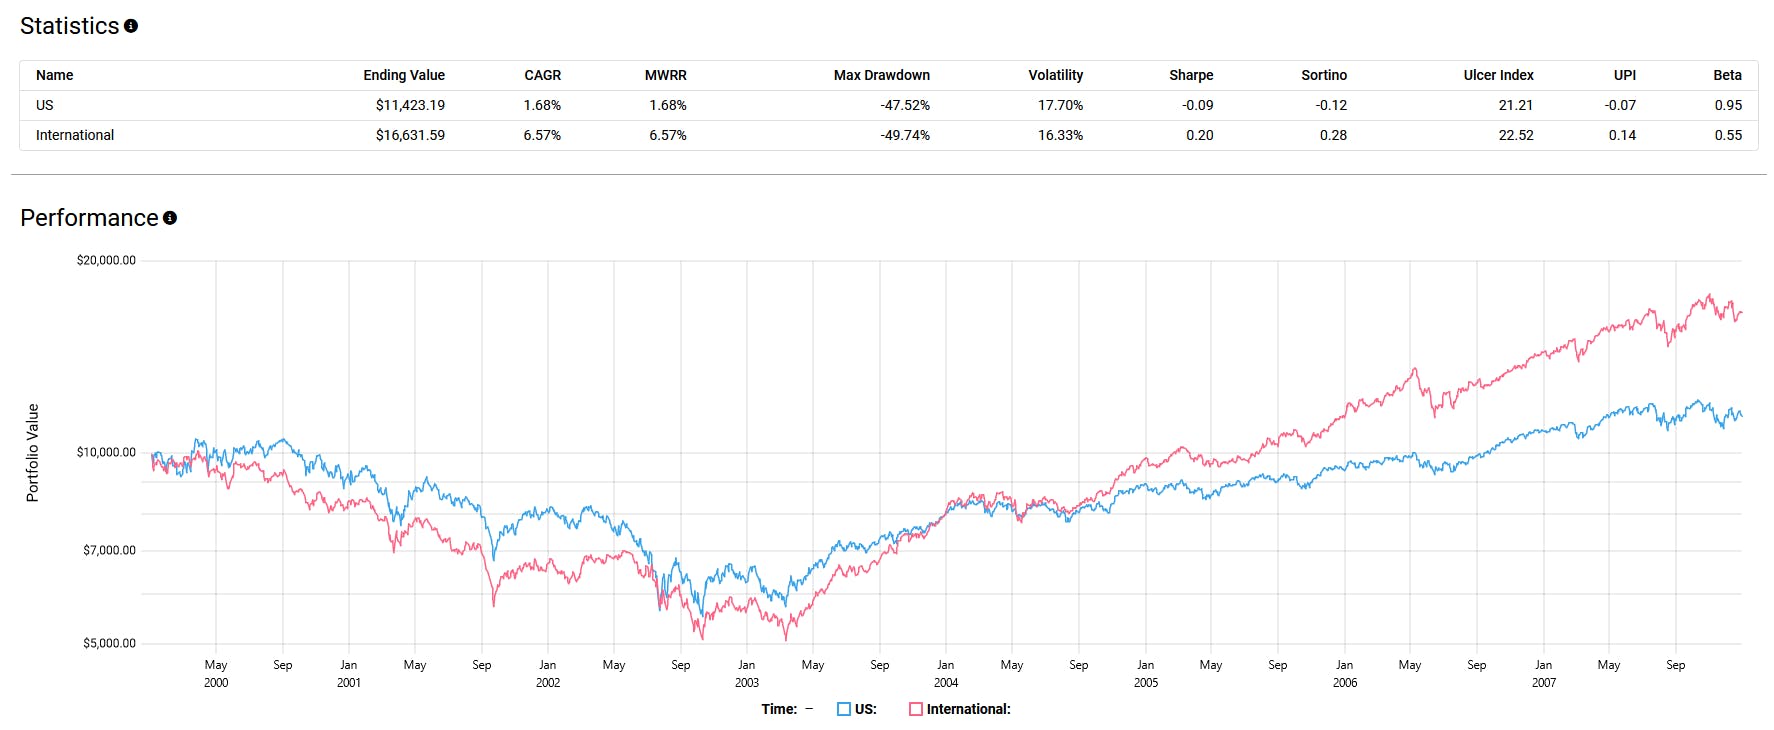
It's easy to look at the last decade, marvel at the outperformance of U.S. stocks, and go all-in on them. However, it's much harder to look back another 10 years and imagine stagnant returns for the better part of a decade. That's the reality U.S.-only investors endured from 2000 to 2008, known as the "lost decade."
During this time, U.S. stocks returned an annualized 1.68% after the run-up in valuations due to the dot-com bubble burst, leading to three consecutive years of losses from 2001 to 2003. However, investors who diversified internationally avoided the brunt of this, with developed and emerging markets collectively returning 6.57%.

Will history repeat itself? Nobody can say, but given how affordable and accessible ETFs are these days, it's more or less a free lunch to include an international allocation in your portfolio. Here are three WisdomTree fundamentally weighted ETFs that could provide broad or targeted international exposure.
WisdomTree International Hedged Quality Dividend Growth Fund
For broad ex-North American exposure, WisdomTree offers IHDG. This ETF has garnered a five-star Morningstar rating out of its peer group of 380 funds, signaling that it has historically performed at the top of the pack when it comes to risk-adjusted returns.
Instead of just weighting holdings based on market cap, IHDG employs a fundamentals-based index. This index selects 300 companies from the WisdomTree International Equity Index based on growth and quality factors.
The growth factor is determined by long-term earnings growth expectations, while the quality factor ranking is based on three-year historical averages for return on equity and return on assets.
The index also emphasizes yield, a traditional value screen, by weighting holdings based on annual cash dividends paid. This approach ensures that investors are gaining exposure to high-quality, high-growth companies and those that provide a reliable income stream.
To mitigate the adverse effects of a historically strong U.S. dollar, the ETF is currency hedged. This ensures that investors are exposed only to the returns of the underlying equities, rather than the fluctuations in foreign exchange rates.
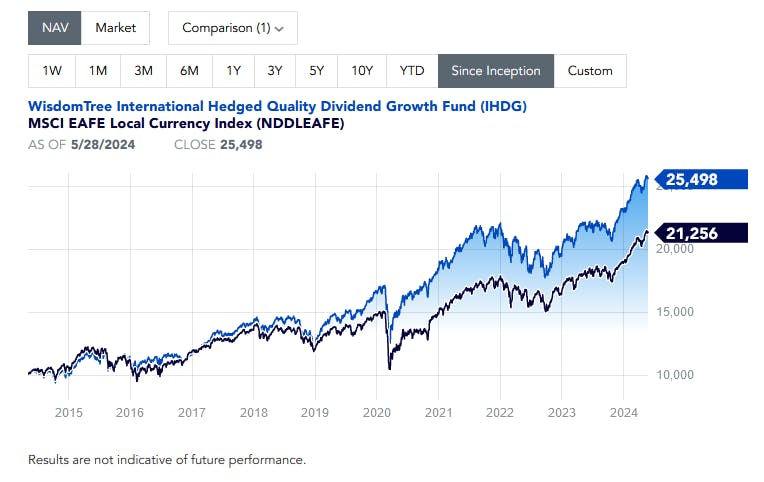
Since its inception, the ETF has strongly outperformed its benchmark, the MSCI EAFE Local Currency Index (NDDLEAFE), even net of a 0.58% expense ratio.

WisdomTree Japan Hedged Equity Fund
To combat the effects of a historically weak Japanese Yen versus the U.S. dollar, DXJ also uses a currency-hedged index.
This means the ETF should outperform an equivalent non-currency hedged investment when the Yen is weakening relative to the U.S. dollar, which has been the case historically and continues to be true today, with the Yen down significantly year to date.
But that isn't the only way DXJ differs. The ETF also eschews the usual approach of indexing most available Japanese equities by market cap. Instead, it focuses on dividend payers that derive less than 80% of their revenue from sources in Japan.
This strategy provides a more significant global revenue base, tilted towards exporters, offering a unique edge by capitalizing on companies with robust international operations.
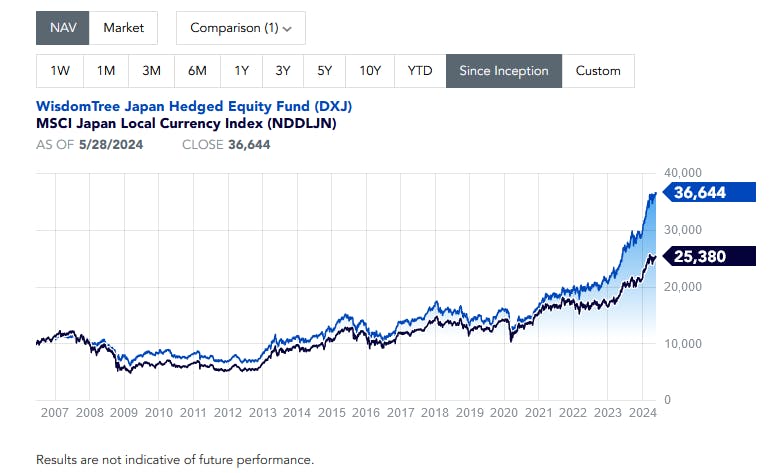
Again, this strategy has paid off historically, with DXJ strongly outperforming the MSCI Japan Local Currency Index (NDDLJN), even net of a 0.48% expense ratio.

WisdomTree India Earnings Fund
Many of the Indian equity ETFs on the market charge high expense ratios to either weight the holdings by market cap or even equally weight them.
This introduces inefficiencies—the first approach can result in high concentrations in a particular few large-cap Indian equities like HDFC Bank and Reliance Industries (over 20% of an ETF in one case), while the latter can cap momentum and result in higher turnover.
The approach that has historically outperformed both is a fundamental indexing strategy that emphasizes the most profitable companies.
That's what EPI's benchmark, the WisdomTree India Earnings Index, does. It weights foreign-investment-eligible Indian equities in the Index based on their earnings in their fiscal year.
The result is a much less top-heavy portfolio, with the top 10 holdings making up around 37% as of May 29th, and a lower 22% concentration in financials.
Historically, this ETF has outperformed similarly priced competitors such as the iShares India 50 ETF and the First Trust India NIFTY 50 Equal Weight ETF
This content was originally published by our partners at ETF Central.
