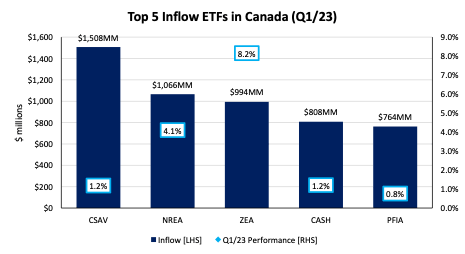
As the first quarter of 2023 wraps up, there is a wealth of data for investors to sort through. ETF inflows are of particular importance as they are often seen as a proxy for market sentiment. So, While inflow data don’t necessarily impact the performance of underlying securities, it does give a sense to where the puck is heading in terms of investor capital.
In this article, we highlight the five ETFs with the highest inflows ETFs in Canada throughout the first quarter of 2023.
Top Five Inflow ETFs in Q1/23
In reviewing the ETF flow data, an initial trend we notice is the focus on high-interest and inflationary-hedged investment vehicles. Also, some surprises on inflows in International investments and active fixed-income investing. Continue reading for a summary of the top five.

Source: TrackInsight, 2023
CI High Interest Savings ETF (TSX:CSAV) (CSAV)
- AUM: $6.9 billion
- Expense Ratio: 0.15%
- Q1 Performance: +1.2% return
- Q1 Inflow: $1.5 billion
We kick things off with the highest inflow ETF through the first three months of the year in Canada—the CI First Asset High Interest Savings ETF (CSAV), offered by CI Global Asset Management. Launched in the Summer of 2019, this ETF is a proxy for high interest savings accounts. As well as being highly liquid and relatively low-cost, it provides monthly distributions—an ideal choice for low-risk tolerant, income-focused investors.
It comes as no surprise that CSAV tops the list given inflationary pressures are still driving a prolonged (and aggressive) rate-hiking cycle. This means that high interest savings deposits will continue to yield higher returns in the coming months. Moreover, market volatility of late means that many investors are sitting on cash and risk-free assets as they wait for macro conditions to firm up, again making CSAV a popular choice.
NBI Global Real Assets Income ETF (TSX:NREA)(NREA)
- AUM: $1.1 billion
- Expense Ratio: 1.03%
- Q1 Performance: +4.1% return
- Q1 Inflow: $1.1 billion
For those seeking inflation protection but wanting more juice in their returns than a high-interest savings account can provide —look no further than NBI Global Real Assets Income ETF (NREA). NREA is offered by National Bank, one of the “Big Six” banks in Canada and invests in international infrastructure and real estate publicly-traded companies.
High inflows into the fund indicate that investors think inflation will be here to stay longer than it’s welcome. Real assets tend to outperform when there is high inflation as they will generally generate increasing cash flows or increase in value along with inflation. NREA holds a host of pipeline companies, real estate companies, and utilities—all of which can increase their tolls, rents, and fees in times of high inflation.
BMO (TSX:BMO) MSCI EAFE Index ETF (ZEA)
- AUM: $6.8 billion
- Expense Ratio: 0.87%
- Q1 Performance: +8.2% return
- Q1 Inflow: $1.0 billion
BMO’s MSCI EAFE Index ETF tracks the performance of the MSCI EAFE Index, an equity index which represents large and mid-cap companies around the world (excluding the U.S. and Canada). This is an interesting addition to this quarter’s list in so much as it is focused on international markets suggesting that investors are beginning to look further afield for excess returns.
This ETF includes constituents within European and Middle East countries such as Switzerland, Spain, Germany, France and Israel, in addition to Pacific markets such as Australia, Hong Kong, Japan and Singapore.
The ETF holds a total of 795 public companies across a broad range of sectors and factors, making it a well-diversified, international ETF for Canadian investors.
Horizons High Interest Savings ETF (TSX:CASH)
- AUM: $2.3 billion
- Expense Ratio: 0.16%
- Q1 Performance: +4.1% return
- Q1 Inflow: $808 million
In terms of the fourth name on our list, Horizons High Interest Savings ETF (CASH) saw similar tailwinds as the #1 ranked CSAV. CASH is noticeably smaller in terms of AUM however and costs 1 basis point (0.01%) more than CSAV.
All-in-all CASH provides essentially the same monthly income and low-risk profile for investors that CSAV does.
Picton Mahoney Fortified Income Alternative Fund ETF (TSX:PFIA)(PFIA)
- AUM: $1.0 billion
- Expense Ratio: 1.23%
- Q1 Performance: +0.8% return
- Q1 Inflow: $764 million
Rounding out our list is the active long/short credit fund offered by Picton Mahoney. This ETF saw inflows as investors looked for ways to outperform the overall fixed income market by letting experienced fund managers allocate capital on their behalf.
PFIA aims to provide income and capital gains through a long/short strategy that is largely centered around corporate bonds while retaining a low correlation to other income assets.
The inflows to this ETF show that investors still have an appetite for active strategies, especially when market conditions are volatile.
Data as of April 5, 2023.
This content was originally published by our partners at the Canadian ETF Marketplace.
