Household equity allocations are again sharply rising, as the “Fear Of Missing Out” or “F.O.M.O.” fuels a near panic mentality to chase markets higher. As Michael Hartnett from Bank of America (NYSE:BAC) recently noted:
“Stocks are up a ferocious +25% in 5 months, which has happened just 10 times since the 1930s. Normally, such surges occur from recession lows (1938, 1975, 1982, 2009, 2020), but, of course, we did not have a recession in 2023, according to the Biden administration. These surges also occur at the start of bubbles (Jan’99).”
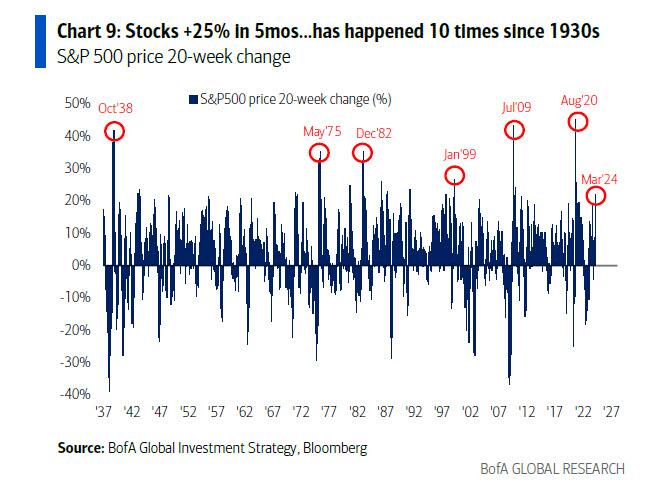
As discussed in the recent Bull Bear Report, we can only identify bubbles in hindsight. Such is the problem with trying to “time” a market top, as they can last much longer than logic would predict. George Soros explained this well in his theory of reflexivity.
“Financial markets, far from accurately reflecting all the available knowledge, always provide a distorted view of reality. The degree of distortion may vary from time to time. Sometimes it’s quite insignificant, at other times it is quite pronounced. When there is a significant divergence between market prices and the underlying reality, the markets are far from equilibrium conditions.“
Every bubble has two components:
- An underlying trend that prevails in reality and;
- A misconception relating to that trend.
“When positive feedback develops between the trend and the misconception, a boom-bust process gets set into motion. The process is liable to be tested by negative feedback along the way, and if it is strong enough to survive these tests, both the trend and the misconception get reinforced.
Eventually, market expectations become so far removed from reality that people get forced to recognize that a misconception is involved. A twilight period ensues during which doubts grow, and more people lose faith, but the prevailing trend gets sustained by inertia.” – George Soros
In simplistic terms, Soros says that once the bubble inflates, it will remain inflated until some unexpected, exogenous event causes a reversal in the underlying psychology. That reversal then reverses psychology from “exuberance” to “fear.”
What will cause that reversion in psychology? No one knows.
However, the important lesson is that market tops and bubbles are a function of “psychology.” The manifestation of that “psychology” manifests itself in asset prices and valuations that exceed economic growth rates.
Once again, investors are piling into equities and “writing checks that the economy can’t cash.”
An Economic Underpinning
To understand the problem, we must first realize from which capital gains are derived.
Capital gains from markets are primarily a function of market capitalization, nominal economic growth, plus dividend yield. Using John Hussman’s formula, we can mathematically calculate returns over the next 10-year period as follows:
(1+nominal GDP growth)*(normal market cap to GDP ratio / actual market cap to GDP ratio)^(1/10)-1
Therefore, IF we assume that GDP could maintain 2% annualized growth in the future, with no recessions ever, AND IF current market cap/GDP stays flat at 2.0, AND IF the dividend yield remains at roughly 2%, we get forward returns of:
(1.02)*(1.2/1.5)^(1/10)-1+.02 = -(1.08%)
But there are a “whole lotta ifs” in that assumption. Most importantly, we must also assume the Fed can get inflation to its 2% target, reduce current interest rates, and, as stated, avoid a recession over the next decade.
Yet, despite these essential fundamental factors, retail investors again throw caution to the wind. As shown, the current levels of household equity ownership have reverted to near-record levels. Historically, such exuberance has been the mark of more important market cycle peaks.
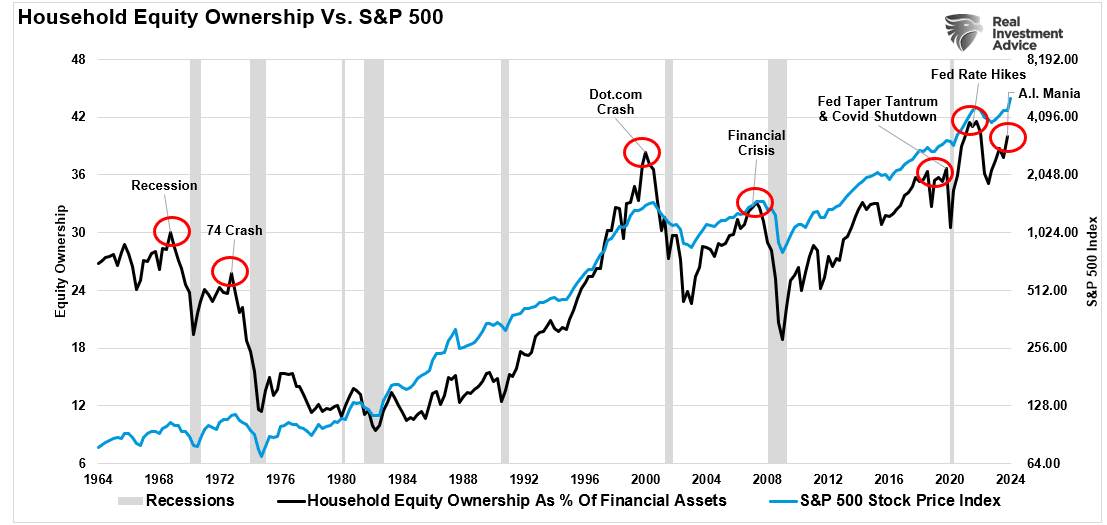
If economic growth is reversed, the valuation reduction will be quite detrimental. Again, such has been the case at previous peaks where expectations exceed economic realities.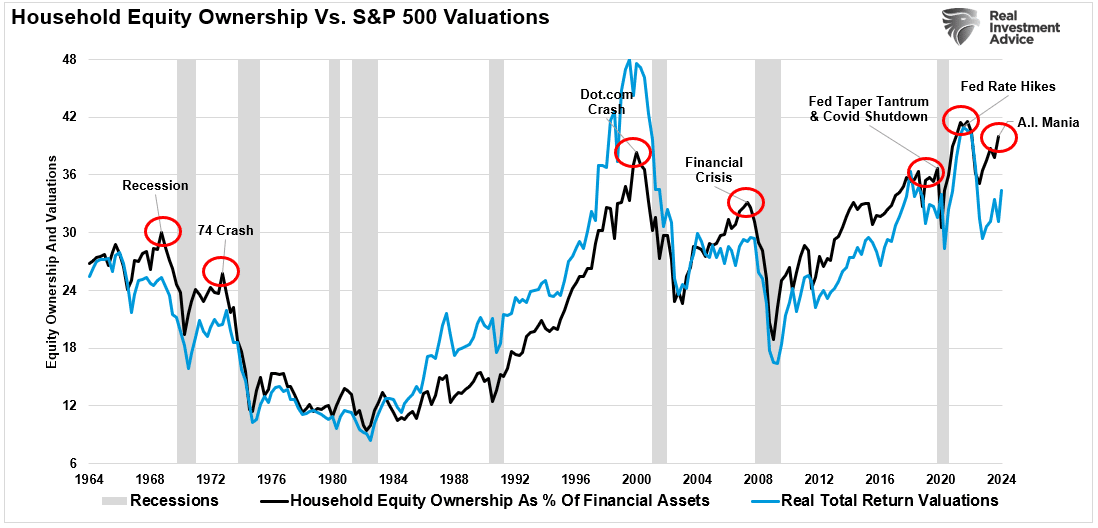
Bob Farrell once quipped investors tend to buy the most at the top and the least at the bottom. Such is simply the embodiment of investor behavior over time. Our colleague, Jim Colquitt, previously made an important observation.
“The graph below compares the average investor allocation to equities to S&P 500 future 10-year returns. As we see, the data is very well correlated, lending credence to Bob Farrell’s Rule #5. Note the correlation statistics at the top left of the graph.”
The 10-year forward returns are inverted on the right scale. This suggests that future returns will revert toward zero over the next decade from current levels of household equity allocations by investors.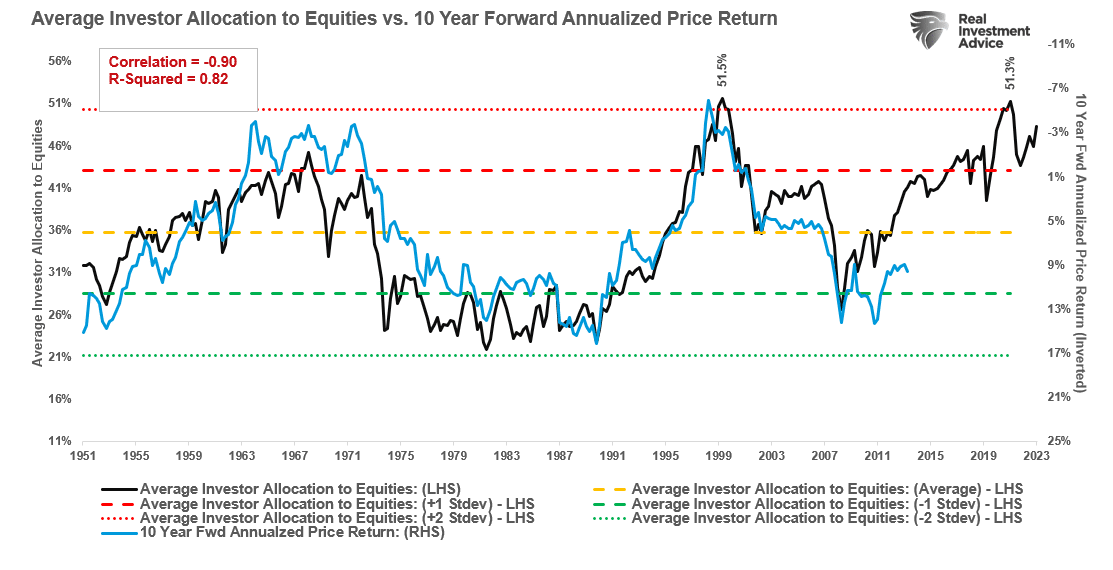
The reason is that when investor sentiment is extremely bullish or bearish, such is the point where reversals have occurred. As Sam Stovall, the investment strategist for Standard & Poor’s, once stated:
“If everybody’s optimistic, who is left to buy? If everybody’s pessimistic, who’s left to sell?”
Everyone is very optimistic about the market. Bank of America, one of the world’s largest asset custodians, monitors risk positioning across equities. Currently, “risk love” is in the 83rd percentile and at levels that have generally preceded short-term corrective actions.
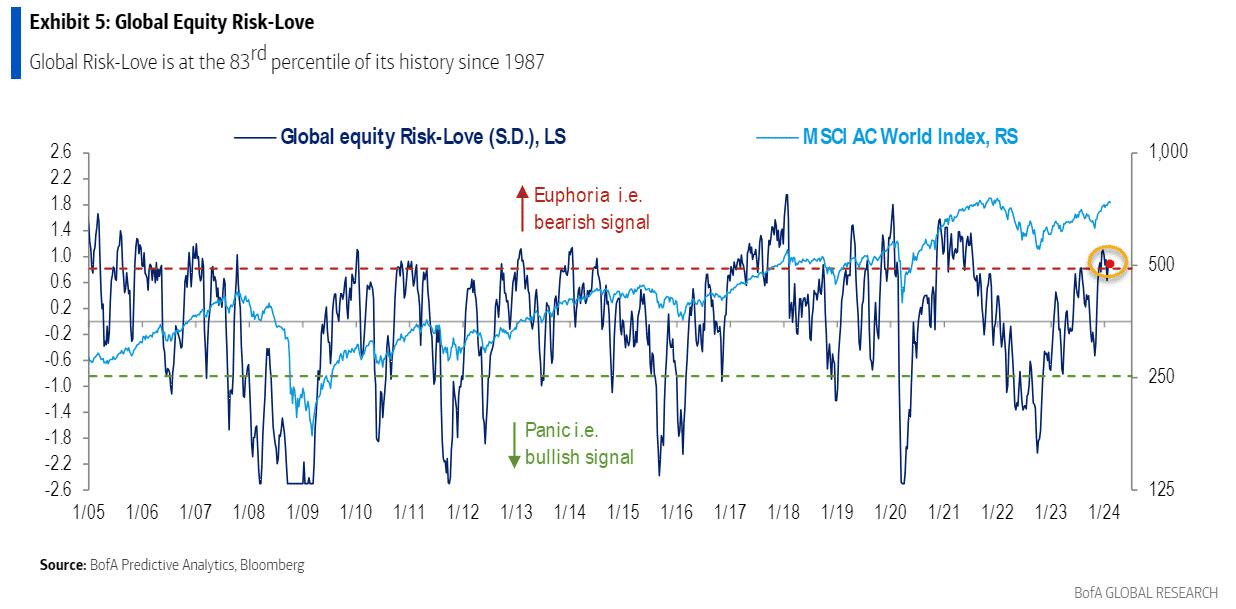
The only question is what eventually reverses that psychology.
A Disappointment Of Hopes
In January 2022, Jeremy Grantham made headlines with his market outlook titled “Let The Wild Rumpus Begin.” The crux of the article is summed up in the following paragraph.
“All 2-sigma equity bubbles in developed countries have broken back to trend. But before they did, a handful went on to become superbubbles of 3-sigma or greater: in the U.S. in 1929 and 2000 and in Japan in 1989. There were also superbubbles in housing in the U.S. in 2006 and Japan in 1989. All five of these superbubbles corrected all the way back to trend with much greater and longer pain than average.
Today in the U.S. we are in the fourth superbubble of the last hundred years.”
While the market corrected in 2022, the reversion needed to reverse the excess deviation from the long-term growth trends was not achieved. Therefore, unless the Federal Reverse is committed to a never-ending program of zero interest rates and quantitative easing, the eventual reversion of returns to their long-term means remains inevitable.
Such will result in profit margins and earnings returning to levels that align with actual economic activity. As Jeremy Grantham once noted:
“Profit margins are probably the most mean-reverting series in finance. And if profit margins do not mean-revert, then something has gone badly wrong with capitalism. If high profits do not attract competition, there is something wrong with the system, and it is not functioning properly.” – Jeremy Grantham
Historically, real profits have always eventually reverted to underlying economic realities.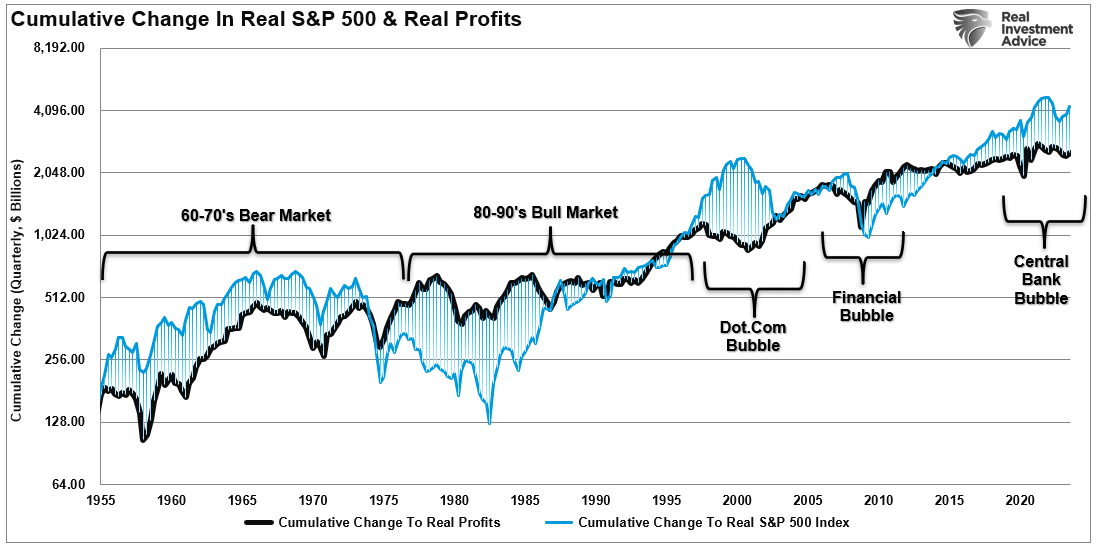
Many things can go wrong in the months and quarters ahead. Such is particularly the case at a time when deficit spending is running amok, and economic growth is slowing.
While investors cling to the “hope” that the Fed has everything under control, there is a reasonable chance they don’t.
The reality is that the next decade could be a disappointment to overly optimistic expectations.
