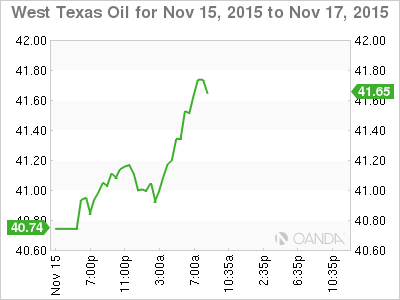
US crude is steady at the start of the week, trading at $41.47 a barrel in Monday’s European session. It’s a quiet start to the week on the release calendar, but world markets are anything but calm after the horrific terror attacks which hit Paris on the weekend. In the US, the sole event on the schedule is the Empire State Manufacturing Index, an important manufacturing indicator. The markets are expecting a reading of -5.3 points.
Oil prices continued to lose ground on Friday, slipping close to the symbolic $40 level. This marked crude’s lowest level since late August. Oil has dropped over the past 10 days, when prices were above $48. Will we see a rebound this week? Monday has started off on a positive note, pushing above the $41 line.
A worldwide glut of crude oil continues to push prices to lower levels, exacerbated by the economic slowdown which has gripped China and other emerging markets. This has led to a worsening “transit glut”. Land storage facilities are at full capacity and some 100 million barrels of crude oil and heavy fuels are being held at sea, leading to tankers full of crude mired in long lines outside of oil hubs around the globe, such as the US, China and Singapore. At the same time, if the Federal Reserve raises rates next month, such a dramatic move would mark a strong vote of confidence in the US economy, and positive market sentiment could translate into actual economic growth which would increase the demand for oil and raise slumping oil prices.
US numbers on Friday were a mix. Retail Sales and PPI both fell short of expectations. Retail Sales came in at 0.1%, while Core Retail Sales was only marginally better, with a small gain of 0.2%. PPI came in at -0.4%, as the manufacturing inflation indicator posted a second straight decline. There was better news on the consumer front, as UoM Consumer Sentiment improved to 93.1 points, beating the estimate of 91.3 points. On Tuesday, we’ll get a look at US CPI and Core CPI, the primary gauges of consumer inflation. These indicators could play a crucial factor of whether the Fed makes a move and raises rates next month. Strong CPI readings could win over Fed policymakers who are concerned about whether the economy is strong enough to withstand a rate hike.
WTI/USD Fundamentals
Monday (Nov. 16)
- 13:30 US Empire State Manufacturing Index. Estimate -5.3 points
Upcoming Key Events
Tuesday (Nov. 17)
- 13:30 US CPI. Estimate 0.2%
- 13:30 US Core CPI. Estimate 0.2%
*Key releases are highlighted in bold
*All release times are GMT
WTI/USD for Monday, November 16, 2015

WTI/USD November 16 at 12:15 GMT
WTI/USD 41.47 H: 41.53 L: 40.74
WTI/USD Technical
| S3 | S2 | S1 | R1 | R2 | R3 |
| 35.09 | 37.75 | 39.87 | 42.59 | 44.30 | 47.04 |
- WTI/USD was flat in the Asian session and has posted slight gains in European trade.
- 39.87 is providing support.
- 42.59 is an immediate line of resistance.
Further levels in both directions:
- Below: 39.87, 37.75 and 35.09
- Above: 42.59, 44.30, 47.04 and 49.06
