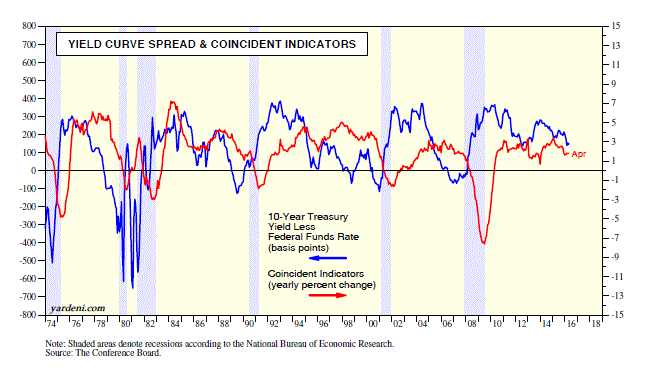
The spread between the 10-Year US Treasury bond yield and the federal funds rate is one of the 10 components of the Index of Leading Economic Indicators compiled monthly by the Conference Board. There is no trend in this series, which tends to cycle around zero. It is widely deemed to be one of the more accurate business-cycle indicators, predicting economic growth when it is positive and a recession when it is negative. The spread does tend to lead the y/y growth cycle in the Index of Coincident Economic Indicators.
Of course, the spread is also available on a daily basis. A more sensitive version of this leading indicator is the spread between the 10-year Treasury yield and the 2-Year Treasury yield. That’s because the latter tends to anticipate moves in the federal funds rate, which is managed by the Fed. Currently, the spread is still positive but narrowing. It was 96bps on Friday, May 20, down from the most recent cyclical high of 266bps during December 31, 2013.
Interestingly, the spread has been narrowing as the Fed has been moving toward normalizing monetary policy. When QE was terminated at the end of October 2014, the spread was 185bps. It was down to 128bps on December 16, 2015, when the Fed hiked the federal funds rate by 25bps. It was down to 93bps following the release on Wednesday, May 18, of April’s FOMC minutes, which heightened expectations of a rate hike at the June 14-15 meeting of the FOMC.
The FOMC is tightening monetary policy because Fed officials believe that the US economy is showing more signs of sustainable growth with inflation rising back near their 2% target. Yet the yield curve is warning that the Fed’s moves could slow the US economy and halt the desired upturn in the inflation rate. Another possibility is that while the US economy might be strong enough to tolerate the normalization of US monetary policy, the global economy is much more vulnerable to Fed tightening moves.
It’s a small world after all, and it seems that national economies and financial markets have become more interdependent than ever as a result of globalization. Fed officials are still operating as though the US economy is relatively independent of the rest of the world. Until recent FOMC minutes, overseas economic and financial developments were almost never mentioned in the minutes. Nor was the foreign-exchange value of the dollar. The US economy may still be relatively independent, but that’s not to say that other national economies and their financial markets aren’t more dependent on the US and on Fed policy than ever before. Consider the following:
(1) World business-cycle indicators. The yield curve spread is often shown on a chart as a leading indicator for the y/y growth in US industrial production, which is one of the four components of the US Index of Coincident Economic Indicators. Given the size and importance of the US economy, it isn’t surprising to see that the US yield spread sometimes has been a good leading indicator of the growth rates of both global industrial production and the volume of world exports. It may be increasingly so now thanks to the ongoing globalization of national economies and financial markets.
(2) S&P 500 revenues and earnings. It also isn’t surprising to see that the growth rate of S&P 500 revenues per share is highly correlated with the growth rates of world industrial production and the volume of global exports. Roughly half of S&P 500 revenues comes from abroad. The global economic slowdown over the past couple of years certainly has weighed on US company revenues, which have weakened further due to the strong dollar since late 2014. In turn, the weakness in revenues and earnings has undoubtedly weighed on US companies’ spending in the US and overseas.
The yield curve spread on a weekly basis has been highly correlated with the y/y growth rates in both the forward revenues and forward earnings of the S&P 500. The recent narrowing of the spread isn’t a good omen for either of them.
(3) Central banks’ policy divergence. All of the above suggests that the US yield curve may be a good leading indicator not only for the US economy but also increasingly the world economy. The Fed’s monetary normalization has pushed up the 2-year Treasury yield from a 2014 low of 0.34% on October 15 to 0.91% on May 23. This reflects the relative strength of the US economy, particularly compared to the weakness in the Eurozone and Japan, which has forced both the ECB and BOJ to double down on their ultra-easy monetary policies, with more QE and negative interest rates.
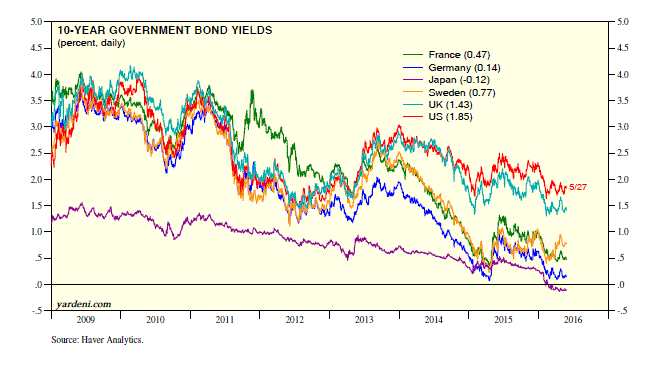
The result has been that global fixed-income investors have been buying more US bonds because their yields exceed those available in the Eurozone and Japan. In other words, the short end of the yield curve may reflect the relative strength of the US economy and Fed tightening, while the longer end reflects weak global economic activity and easing by the other major central banks.
The divergence between the tightening of the Fed’s monetary policy and the ultra-easy policies of the ECB and BOJ has certainly contributed to the strength in the dollar and weakness in both the euro and yen since mid-2014. However, so far, the latter have failed to boost exports in the Eurozone and Japan, while the strong dollar has weighed on US exports.
Could it be that while the US economy can handle a gradual normalization of monetary policy in the US, the rest of the world cannot do so? That may be the message conveyed by the US yield curve.
(4) Kuroda’s kabuki. Japan’s economy certainly remains fragile. The BOJ adopted negative interest-rate policy (NIRP) at the end of January. The Japanese 10-Year government bond yield was -0.10% on May 23. Yet the yen is 15% above last year’s low on June 5. On May 23, we learned that Japan’s flash M-PMI fell for the fifth consecutive month in May to 47.6, the lowest since December 2012. We also learned that Japan’s exports (in yen) fell 9.5% y/y during April to the lowest since January 2014. Imports plummeted 20.0% to the lowest since December 2010!
(5) Draghi’s drag. The ECB first introduced NIRP on June 5, 2014. The German 10-Year government bond yield was only 0.18% on May 23. Yet the Eurozone’s industrial production rose just 0.2% over the 12 months through March. Just as frustrating for the ECB is that the CPI inflation rate remains just below zero. It was just -0.2% y/y during April, according to the flash estimate, while the core rate was 0.7%.


