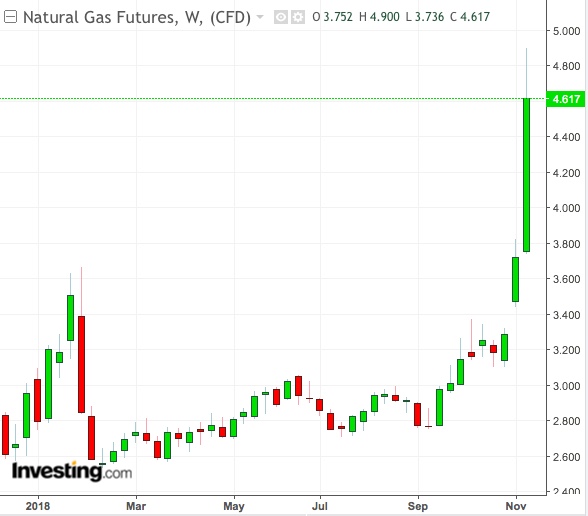
Not many can recall the last time the US natural gas market, known as the ‘Wild West” of commodities for its legacy of bucking-bronco-like price swings, jumped 18 percent in a day.
That happened on October 28 2010, when a serial derecho, or windstorm with severe thunderstorms, generated a pre-winter blizzard across most of the US, causing heating demand to spike.
Explosive Price Surge
That day, eight years ago, the front-month gas contract on the New York Mercantile Exchange gained almost 60 cents per million British thermal units to settle at $3.89 per mmBtu.
So, this Wednesday, when NYMEX’s front-month gas settled up 74 cents, or 18 percent, at a near 5-year high of 4.84 per mmBtu on fears of a pre-winter storm market, participants ran out of superlatives trying to characterize the explosive surge in a commodity that had seldom moved more than a couple percent in a day during the past four years.

The year-to-date gain in natural gas is now just shy of 60 percent, the highest for any commodity. The nearest competitor, oats, is up by just 20 percent.
This is in stark comparison to oil, an energy peer as it were, which has given up as much as 25 percent in the past six weeks alone.
'Fear Of God' Grips Gas Traders
“Tight storage and cold weather has finally put the fear of God in traders,” Dan Flynn at Chicago’s Price Futures Group wrote after Wednesday’s rally in gas, citing Winter Storm Avery, which weather models showed was headed for the Northeast after spreading a mix of rain, snow and ice in parts of the mid-Mississippi Valley and Ohio Valley.
Some analysts were remorseful for having misled others with their forecasts. “A lot of things I predicted have been wrong, as I was bearish,” confessed Scott Shelton, energy broker at ICAP in Durham, North Carolina, who writes daily notes on both oil and gas.
Shelton said while his initial calls looked great when the market was moving in his favor, “it now has gone horribly wrong” as he had underestimated the colder-than-usual weather for November. Shelton’s words underscore the caution expressed by some market participants who remember the 2010 spike: natural gas should forever be remembered as a sleeper market that can suddenly turn into a killer, capable of felling even the best of traders with sudden, double-digit swings.
While it’s too early to know who the winners and losers were of Wednesday’s epic move, there’s a long list of traders in the past who became casualties by incorrectly betting on demand for gas during peak summer cooling and winter heating periods.
Among the vanquished, the most memorable has to be Brian Hunter, a Canadian-born gas trader, who after a few high profile wins in the early 2000s, lost nearly $7 billion in 2006, blowing up his hedge fund employer Aramanth Advisors. Interestingly, Hunter fell to a peculiar trade in natural gas called the ‘widowmaker,’ which involves a play between the March and April months, when switches between cold and warm weather become particularly dicey calls for gas traders.
Among the victors, the biggest would arguably be John Arnold, a former Enron trader who used his proprietary hedge fund Centaurus Advisors to take bets on the opposite side of Hunter's play in 2006, instantly making him one of America’s youngest billionaires by the age of 33.
Difficult Market To Read
Notwithstanding such anecdotes, natural gas is a market of many contrasts. Despite being the fuel of choice for US power generators and exported in liquefied form to about three dozen countries, open interest in natural gas futures itself is under $76 billion versus the more than $116 billion for US crude oil.
This year, the gas market has been particularly hard to read for most traders. Abundant volumes of gas, sourced from primary drilling and also obtained in secondary form during drilling for shale crude, has led to record production of the fuel—not unlike the situation in crude oil.
Despite that overwhelming output, storage levels of gas were never in danger of tipping, thanks first to strong summer heat, then to early cold that kept air conditioners and heaters running on overdrive. While prices north of $3 per mmBtu had been the norm in recent months, the shock to the upside of $4 arrived this week when market bulls sensed a colder-than-usual November.
And before the bears knew what hit them, the market was at the cusp of $5 pricing. With at least 3-1/2 months of potential cold weather left, the path of least resistance certainly seems lower for now.
Dan Myers, analyst at Houston-based Gelber & Associates said:
“The addition of a trend to colder forecasts in late November is further reinforcing the market’s sense that we are heading straight into a major winter.”
Dominick Chirichella of the Energy Management Institute in New York added:
“Low inventories and cold temperatures are keeping the bears out of the market, with the bulls solidly in control.”
