• All eyes will be on the ECB policy meeting Over the past month, ECB members emphasized that the door remains open for further easing measures. They even made technical changes at their last meeting to the existing QE program, by increasing the limit for buying individual bonds to provide flexibility for further action if required. What’s more, on last Thursday, ECB member Ewald Nowotny sent the euro tumbling when he said the Bank needs to do more to lift inflation and growth, fueling expectations for further measures at this meeting. However, fresh comments early this week, showed that it’s too early to talk about extending QE beyond September 2016. These comments are in line with the on-hold stance from several ECB officials, including ECB President Draghi, regarding the need for more stimulus. In our view, we could see more dovish rhetoric, even a promise of an expansion of the current program, either the size or the horizon, but no action yet. An announcement of further measures could challenge the effectiveness of the stimulative measures taken so far. They may also want to wait to see what the Fed will do before taking further actions. We will be looking for hints that further policy accommodation could be introduced at the December meeting, when the ECB updates the Q4 staff economic forecasts. In such case, EUR could weaken.
• Bank of Canada policy meeting Bank of Canada kept its benchmark interest rate unchanged at 0.5%, as was widely expected. In the statement accompanying the decision, they warned that lower prices for oil and other commodities will weigh more than expected on Canada’s economy. This has led to a modest downward revision to the Bank’s growth forecast for 2016 and 2017, which put CAD under renewed selling pressure. Even though the Bank gave no hint that there is need for further stimulus, the lowered growth figures, along with further weakness in energy-related business investment, could eventually prompt the Bank to lower rates in the foreseeable future. As for the currency, they said that “the past depreciation of the Canadian dollar are roughly offsetting disinflationary pressures from economic slack, which has increased this year.” So, further weakness in CAD is needed for the economy to remain supported.
• The Commonwealth bank of Australia (AX:CBA), Australia’s leading mortgage lender, said it will raise its standard variable home loan rates by 15bps, to partly offset higher regulatory costs. The move, follows a 20bps increase in mortgage rates by Westpac Banking Corp (N:WBK) last week. The increase in mortgage rates by the country’s largest banks is the same as monetary tightening. AUD fell sharply following the CBA’s note, as these moves raised the likelihood that the Reserve Bank of Australia could cut interest rates again in the near-future.
• Elsewhere, kiwi bounced after the country’s finance minister said that the NZD FX rate has adjusted considerably. NZD/USD rose sharply but found resistance below the 0.6800 level. A break of that zone is needed to trust further bullish extensions.
• Today’s highlights: The UK retail sales for September are coming out. Both the headline and the core (excluding fuel) rates are forecast to have increased. Following the strong employment report released on Wednesday, another positive surprise could keep confidence up and GBP supported. This could cause GBP/USD to aim for another test at the psychological zone of 1.5500.
• In the US, existing home sales for September are expected to have risen after falling in the previous month. Following the improvement in housing starts and building permits for the same month, a more-than-expected improvement looks possible. Another upbeat housing figure would confirm the overall strength of the sector and could boost the greenback, at least temporarily. As far as the housing sector is concerned, we also get the FHFA housing market index for August. The initial jobless claims for the week ended on Oct. 12 and the Chicago Fed National Activity index for September are also to be released.
• Canada’s retail sales are forecast to have slowed in August. The loonie came under increasing selling pressure following the BoC policy meeting and therefore, a disappointment in retail sales could push the currency further down.
• Besides ECB President Draghi, we have two more speakers in Thursday’s agenda. BoE Deputy Governor for Financial Stability Jon Cunliffe speaks at the British Bankers Association international banking conference, and UK Finance minister George Osborne appears before the Treasury Committee to discuss the BoE bill.
The Market
EUR/USD trades in a consolidative manner ahead of the ECB meeting
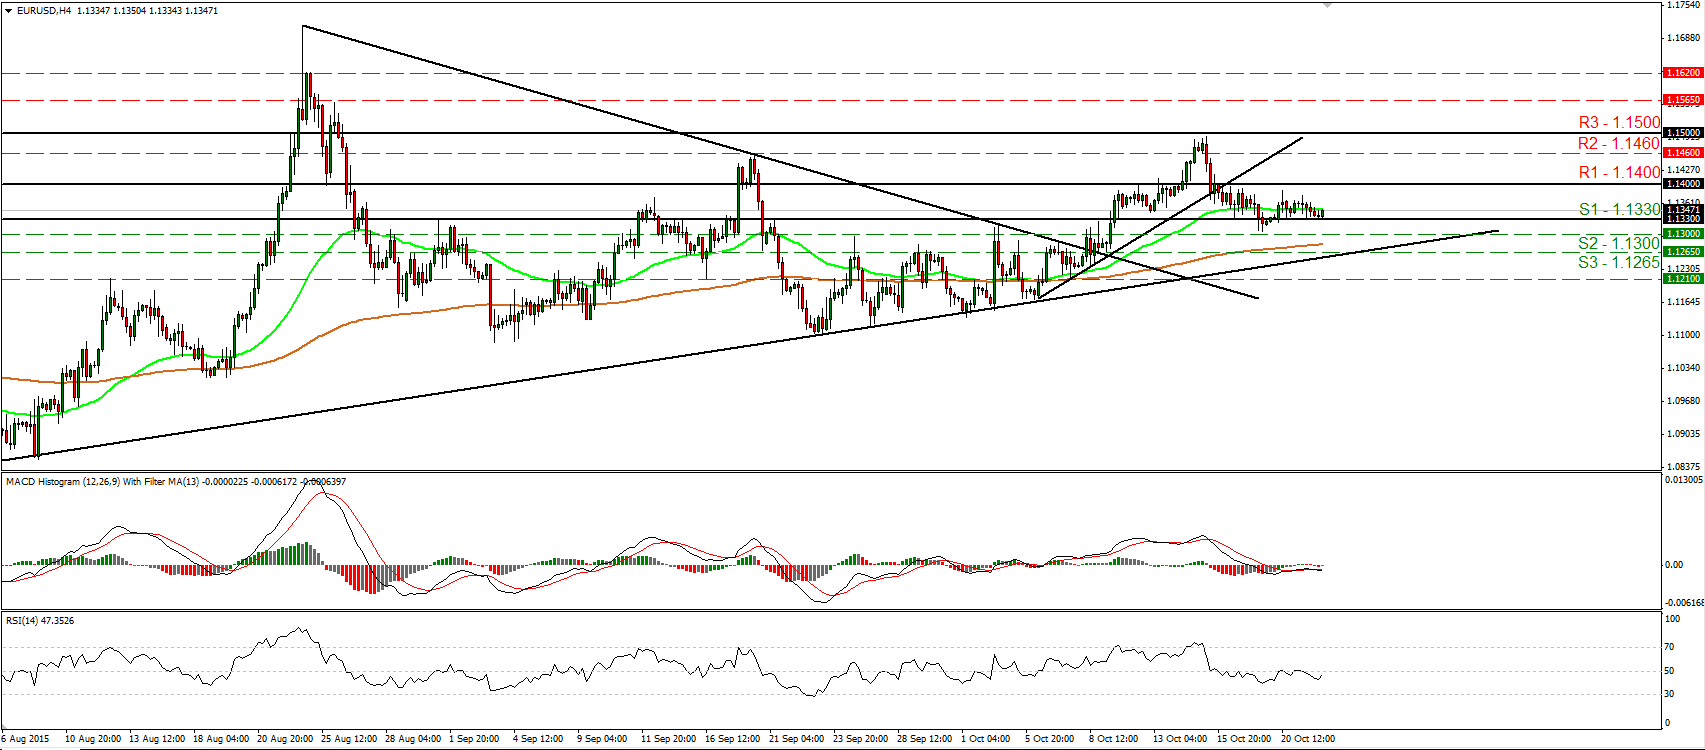
• EUR/USD traded in a consolidative manner on Wednesday, staying between the support of 1.1330 (S1) and the resistance of 1.1400 (R1). Today, the ECB meets to decide on its interest rates. While no change in policy is expected, Bank officials are likely to maintain their dovish stance and reiterate their willingness to do more if needed. Any clues that they are ready to expand or extend the current QE program are likely to weigh on the common currency and push EUR/USD down. A break below the 1.1330 (S1) line could initially challenge the 1.1300 (S2) barrier, while another break below 1.1300 (S2) could aim for the next support at 1.1265 (S3) and the upside support line taken from the low of the 5th of August. Our short-term oscillators stand within their bearish territories, but very close to their equilibrium lines, supporting the neutral near-term picture. In the bigger picture, as long as EUR/USD is trading between the 1.0800 key support and the psychological zone of 1.1500 (R3), I would maintain my neutral stance as far as the overall picture is concerned. I would like to see another move above 1.1500 (R3) before assuming that the overall outlook is positive. On the downside, a break below the 1.0800 hurdle is the move that could shift the picture back negative. • Support: 1.1330 (S1), 1.1300 (S2), 1.1265 (S3) • Resistance: 1.1400 (R1), 1.1460 (R2), 1.1500 (R3)
EUR/GBP hits resistance near 0.7370
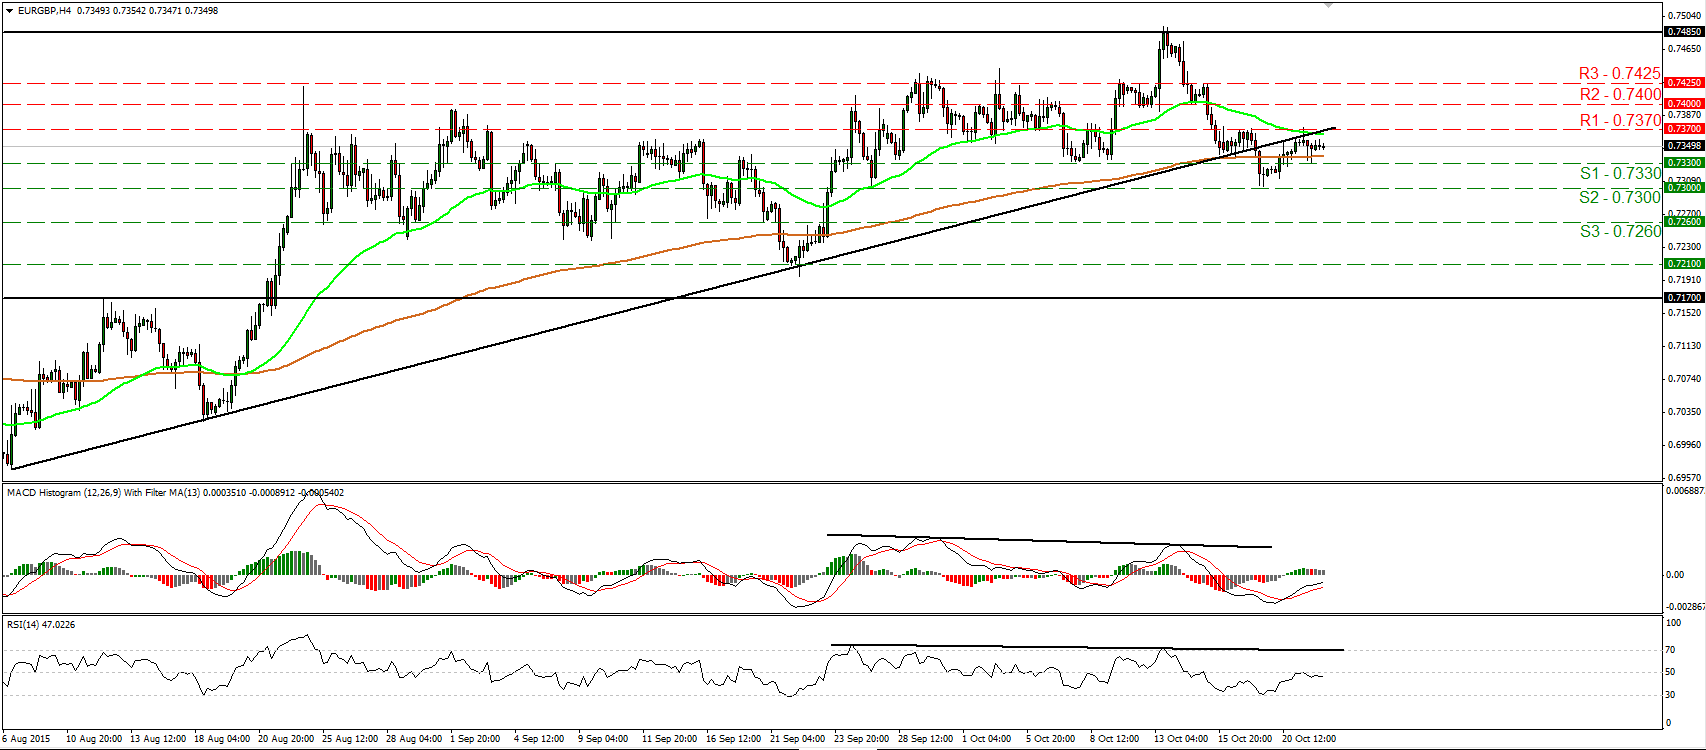
• EUR/GBP traded quietly yesterday after it hit resistance fractionally above the 0.7370 (R1) hurdle. Having in mind that the rate is still trading below the uptrend line taken from the low of the 6th of August, I would consider the short-term picture to stay somewhat negative. Today, a dovish stance by the ECB officials could be the catalyst for the next negative leg. A break below our support of 0.7330 (S1) could open the way for another test near the 0.7300 (S1) zone. The RSI hit resistance at its 50 line and turned somewhat down, while the MACD, already negative, shows signs that it could start topping. These momentum signs corroborate somewhat my view. On the daily chart, the fact that the rate fell below the aforementioned uptrend line after hitting resistance at the key level of 0.7485, alongside the negative divergence between our daily oscillators and the price action, provides ample evidence that EUR/GBP is likely to continue the down road, at least in the short run. • Support: 0.7330 (S1), 0.7300 (S2), 0.7260 (S3) • Resistance: 0.7370 (R1), 0.7400 (R2), 0.7425 (R3)
USD/CAD rallies following the BOC policy meeting
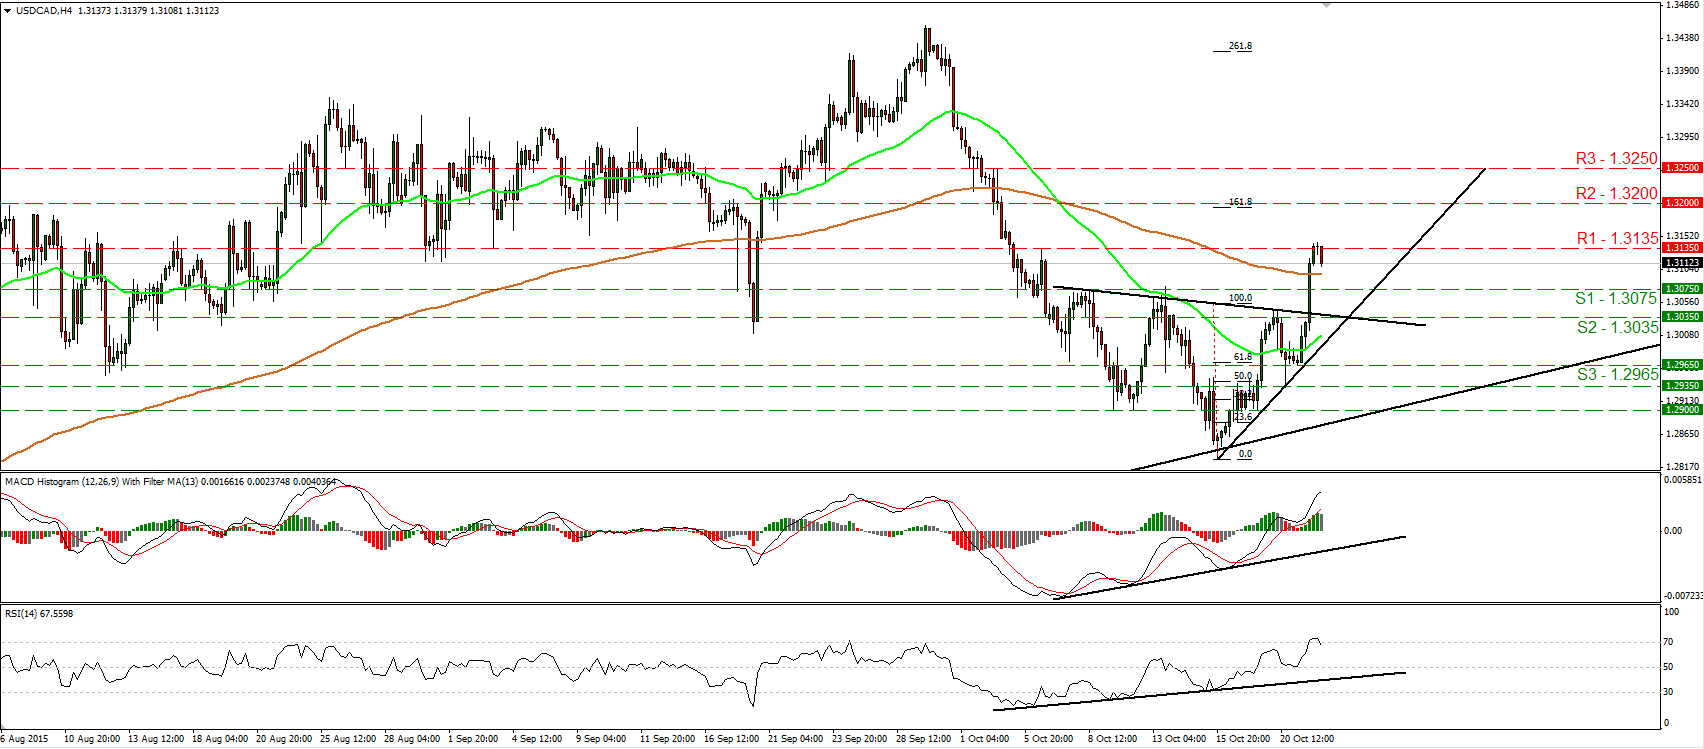
• USD/CAD surged on Wednesday, after the BoC left its benchmark interest rate unchanged and downgraded its growth projections. The rate emerged above the 1.3035 (S2) barrier and the neckline of an inverted head and shoulders formation to hit resistance fractionally above our resistance of 1.3135 (R1). Subsequently, the rate retreated somewhat. Having in mind the reversal given by the completion of the head and shoulders bottom and that the rate is trading above the short-term uptrend line taken from the low of the 15th of October, I would consider the short-term outlook to be positive. A clear move above the 1.3135 (R1) obstacle is likely see scope for extensions towards the 1.3200 (R2) area, which stands marginally above the 161.8% extension level of the height of the pattern. Taking a look at our short-term oscillators though, I see signs that the current setback may continue for a while before the bulls decide to shoot again. The RSI has topped within its overbought territory and fell below its 70 line, while the MACD, although positive, shows signs of topping. On the daily chart, I see that on the 16th of October, the pair rebounded from the medium-term uptrend line taken from the low of the 14th of May. This keeps the longer-term outlook positive as well and increases the possibilities for the pair to trade higher in the foreseeable future. • Support: 1.3075 (S1), 1.3035 (S2), 1.2965 (S3) • Resistance: 1.3135 (R1), 1.3200 (R2), 1.3250 (R3)
Gold tumbles and breaks below 1168
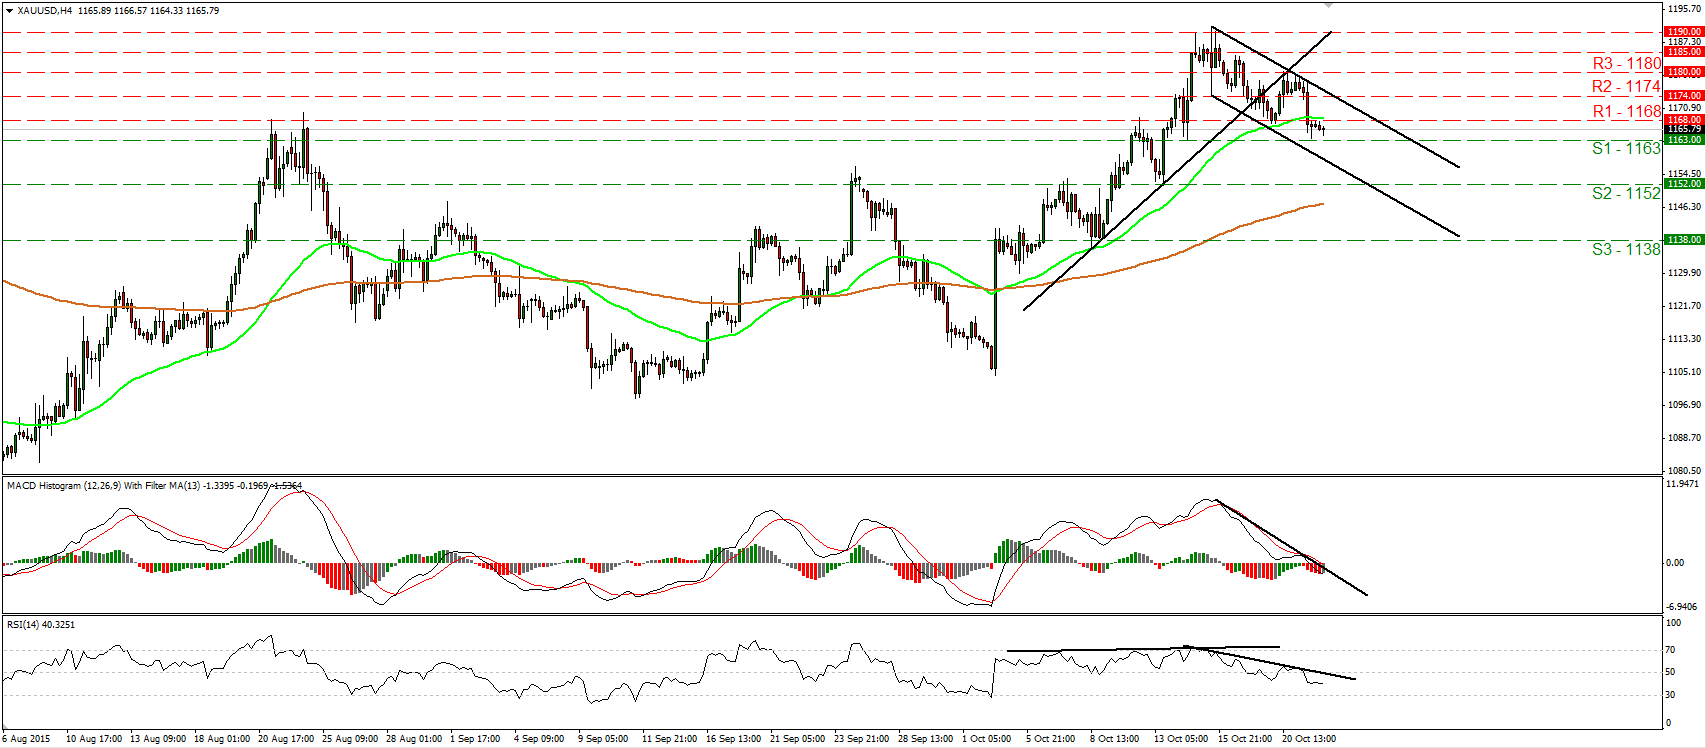
• Gold slid yesterday, falling below the support (now turned into resistance) barrier 1168 (R1) and confirmed a forthcoming lower low on the 4-hour chart. Nevertheless, the decline was halted by our next support at 1163 (S1). Since the metal is trading within a short-term downside channel, I would consider the short-term picture to be negative. Therefore, a break below 1163 (S1) could open the way for the 1152 (S2) obstacle, defined by the low of the 13th of October. Both our momentum studies lie below their respective downside resistance lines, revealing negative momentum and supporting my view for further declines. The RSI fell back below 50, while the MACD, already below its signal line, has turned negative. On the daily chart, the longer-term outlook remains somewhat positive. As a result, I would treat the current short-term downtrend as a corrective phase, at least for now. • Support: 1163 (S1), 1152 (S2), 1138 (S3) • Resistance: 1168 (R1), 1174 (R2), 1180 (R3)
WTI hits support at 44.85
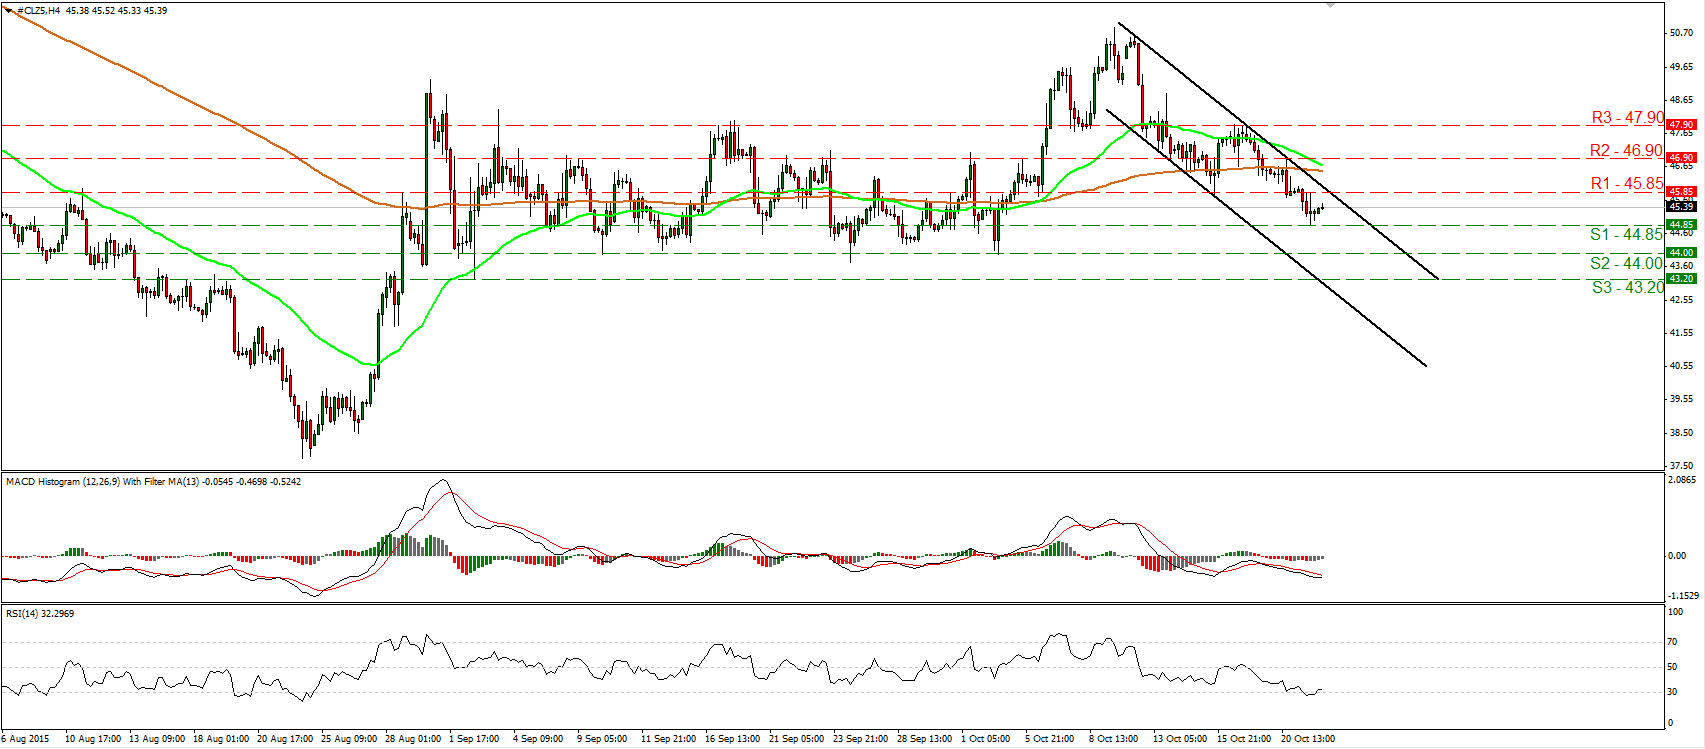
• WTI traded lower yesterday, but found support at 44.85 (S1) and then it rebounded somewhat. The price is still trading within a downside channel, and this keeps the short-term outlook negative in my view. Nonetheless, our short-term oscillators give evidence that the current bounce may continue for a while, even above the upper bound of the aforementioned channel. The RSI rebounded from slightly below 30 and is now pointing up, while the MACD, although negative, shows signs of bottoming. It could cross above its trigger line any time soon. A clear move above 45.85 (R1) is possible to confirm the continuation of the rebound and could pave the way for our next resistance at 46.90 (R2). On the daily chart, WTI printed a higher high on the 9th of October and there is still the possibility for a higher low above the key zone of 44.00 (S2). As a result, I would consider the medium-term picture to stay cautiously positive and I would treat the short-term downtrend as a corrective phase, at least for now. • Support: 44.85 (S1), 44.00 (S2), 43.20 (S3) • Resistance: 45.85 (R1), 46.90 (R2), 47.90 (R3)

