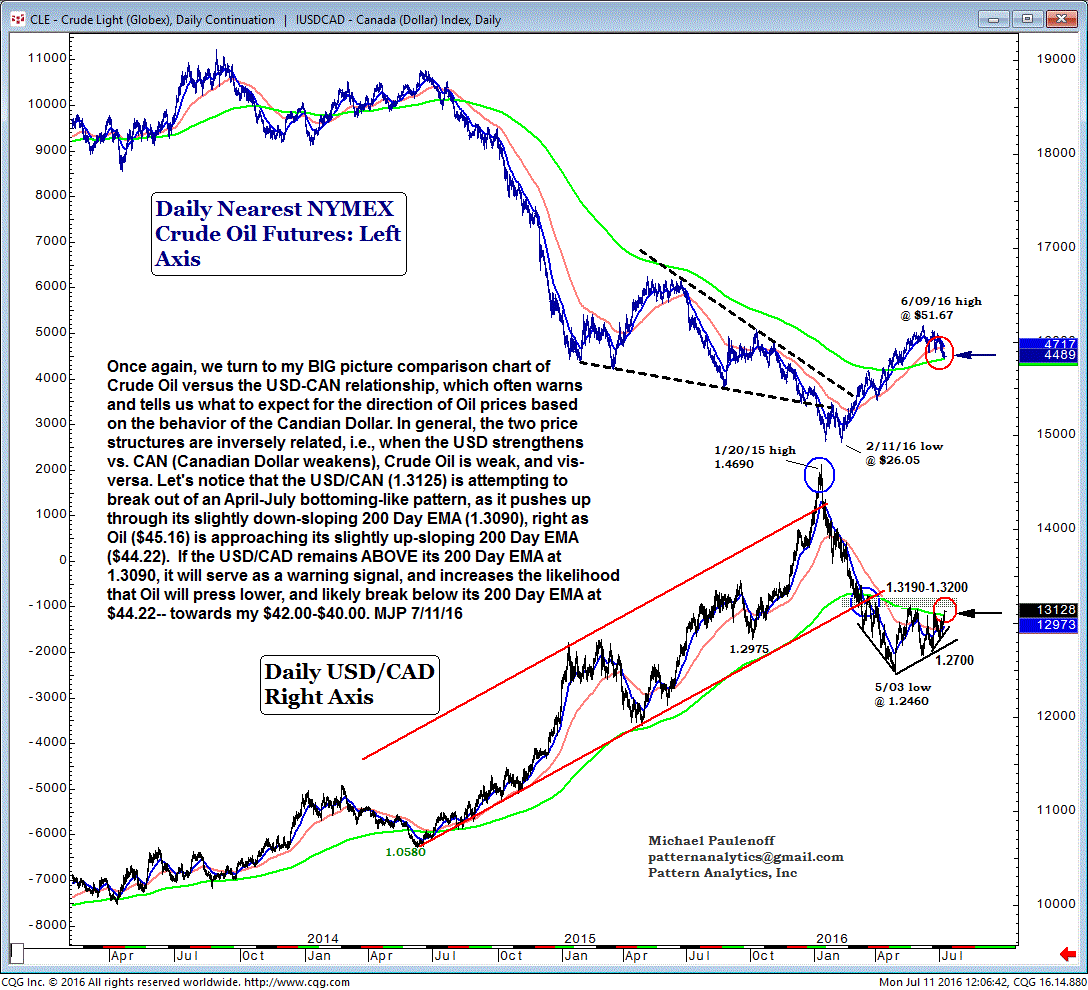
Once again, we turn to my big-picture comparison chart of Crude Oil versus the USD/CAD relationship, which often warns and tells us what to expect for the direction of Oil prices based on the behavior of the Canadian dollar.
In general, the two price structures are inversely related, i.e., when the USD strengthens vs. CAD (Canadian dollar weakens), Crude Oil is weak, and vis-versa.
Let's notice that the USD/CAD (1.3125) is attempting to break out of an April-July bottoming-like pattern, as it pushes up through its slightly down-sloping 200-Day EMA (1.3090), right as Oil ($45.16) is approaching its slightly up-sloping 200-Day EMA ($44.22).
If the |USD/CAD remains above its 200-Day EMA at 1.3090, it will serve as a warning signal, and increases the likelihood that Oil will press lower, and likely break below its 200-Day EMA at $44.22-- towards my $42.00-$40.00.

