In a recent tweet, Bloomberg Senior ETF Analyst Eric Balchunas noted that in the "Big Two" asset managers, BlackRock and Vanguard together possessed double the ETF assets of any other issuer, standing at $2.3 trillion and $2 trillion respectively.
The same dynamic can be seen in the Canadian ETF industry. Despite the firm home-territory advantage possessed by domestic firms like BMO (TSX:BMO) Global Asset Management and CI Global Asset Management, BlackRock and Vanguard have made substantial inroads over the last decade.
Characteristic of this is the highly popular lineup of "asset allocation" ETFs launched by Vanguard and BlackRock in Canada, which have attracted high inflows from DIY investors seeking affordable alternatives to pricier mutual funds and advisor managed portfolios.
A popular pick in the asset allocation ETF lineup for both providers is the "EQT" series, which represents the 100% equity version. Today, I'm pitting two of them head to head for a review: the Vanguard All-Equity ETF Portfolio (VEQT) versus the iShares Core Equity ETF Portfolio (XEQT).
VEQT vs. XEQT: Construction
Both VEQT and XEQT are "ETFs of ETFs" – that is, they wrap numerous other Vanguard and Blackrock (NYSE:BLK) ETFs Canadian and U.S. dollar-denominated ETFs to gain exposure to U.S., Canadian, international developed, and emerging market equities.
In the case of VEQT, as of March 31, 2023 the ETF holds four other Vanguard Canada ETFs in the following proportions:
- Vanguard U.S. Total Market Index ETF (TSX:VUN): 42.91%.
- Vanguard FTSE Canada All Cap (TSX:VCN) (VCN): 29.58%.
- Vanguard FTSE Developed All Cap ex North America (TSX:VIU) (VIU): 20.17%.
- Vanguard FTSE Emerging Markets (TSX:VEE) (VEE): 7.35%.
On the other hand, as of May 4, 2023 XEQT holds these four iShares ETFs in the following proportions:
- iShares Core S&P Total U.S. Stock Market ETF (NYSE:ITOT) (ITOT): 44.12%.
- iShares Core MSCI EAFE IMI ETF (TSX:XEF)(XEF): 25.88%.
- iShares S&P/TSC Capped Composite Index ETF (TSX:XIC) (XIC): 24.91%.
- iShares Core MSCI Emerging Markets ETF (NYSE:IEMG) (IEMG): 4.87%.
Here are some of the differences:
- VEQT only wraps Canadian-denominated ETFs, whereas XEQT holds some U.S.-denominated ETFs in the form of ITOT and IEMG.
- VEQT overweights Canadian and emerging market equities more compared to XEQT, while the latter overweights developed markets more.
- VEQT uses FTSE indices for its ex-U.S. holdings (VUN uses the CRSP Total U.S. Market Index), while XEQT follows S&P and MSCI indexes.
VEQT vs. XEQT: Methodology
The biggest difference between VEQT and XEQT is each ETF's criteria for allocating, rebalancing, and reconstituting the portfolio.
VEQT's prospectus notes that "The portfolio asset mix may be reconstituted and rebalanced from time to time at the discretion of the Sub-advisor." In practice, what we see is a 30% allocation to Canadian equities first, called a home-country bias.
Some investors may disagree with this practice given that Canadian equities constitute around 3% of the world's market-cap weight right now, but Vanguard has good reasons to do so.
For Canadian investors, Vanguard's research suggests that a moderate home country bias like VEQT can lower volatility, improve tax efficiency, and reduce currency risk. XEQT overweighs Canadian equities as well, but at 25% instead of 30%.
After the 30% Canadian equity allocation, the remaining 70% of VEQT is split according to prevailing world market cap weights. For example, U.S. stocks currently account for around 60% of the world. 60% * 70% = 42%, which is very close to the 42.91% VEQT has allocated to VUN right now.
So, if the world market cap weight changes markedly in the future, VEQT's non-Canadian allocation will likely do so as well. Hypothetically, if emerging markets suddenly grew to account for 50% of the world, VEQT's ex-Canadian holding weights will change accordingly to reflect that.
On the other hand, iShares departs from this by assigning fixed weights to each geography. According to its prospectus, XEQT will target weightings of 25% in Canada, 45% in the U.S., 25% in developed, and 5% in emerging, rebalanced at their discretion.
However, the prospectus also notes that BlackRock can change the long-term strategic asset allocation and/or asset class target weights of XEQT at its sole discretion, so if something drastically alters the composition of the world market, XEQT will likely follow suit.
XEQT vs. VEQT: Historical Performance
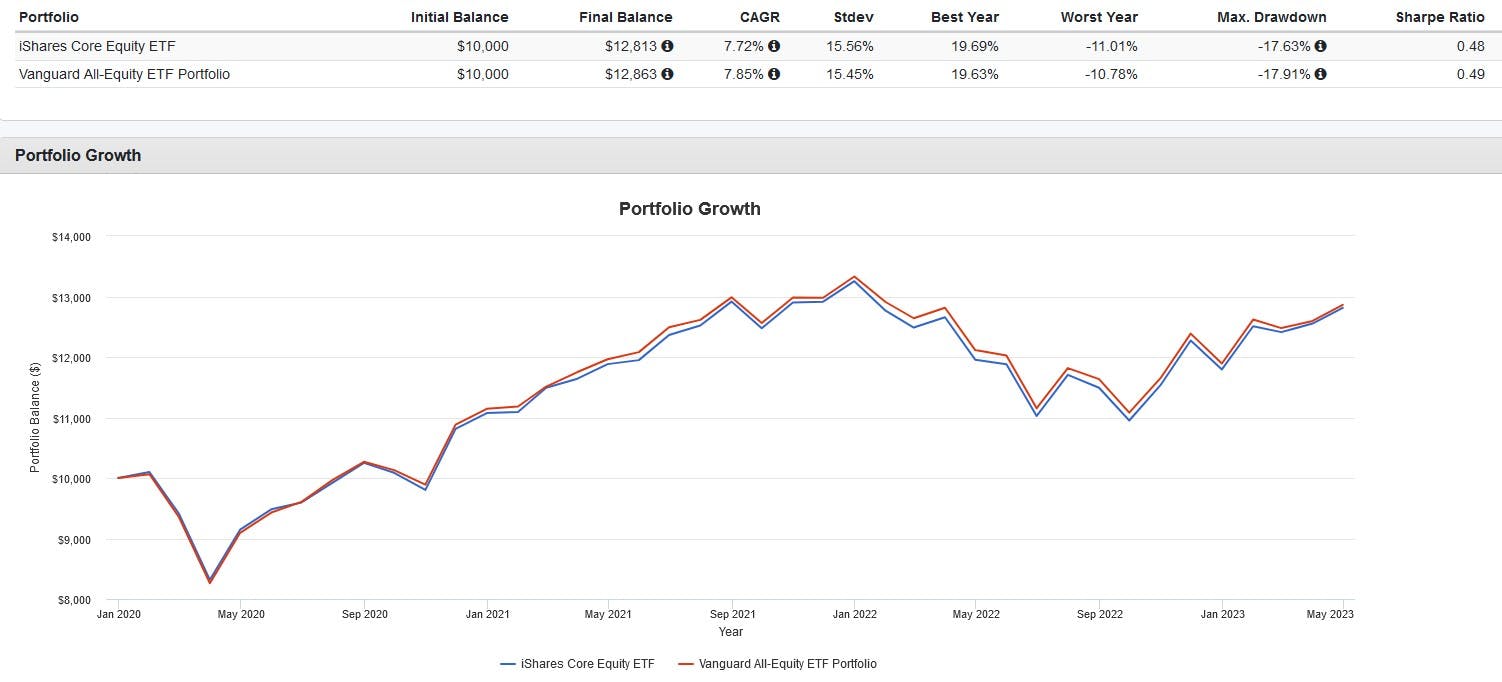
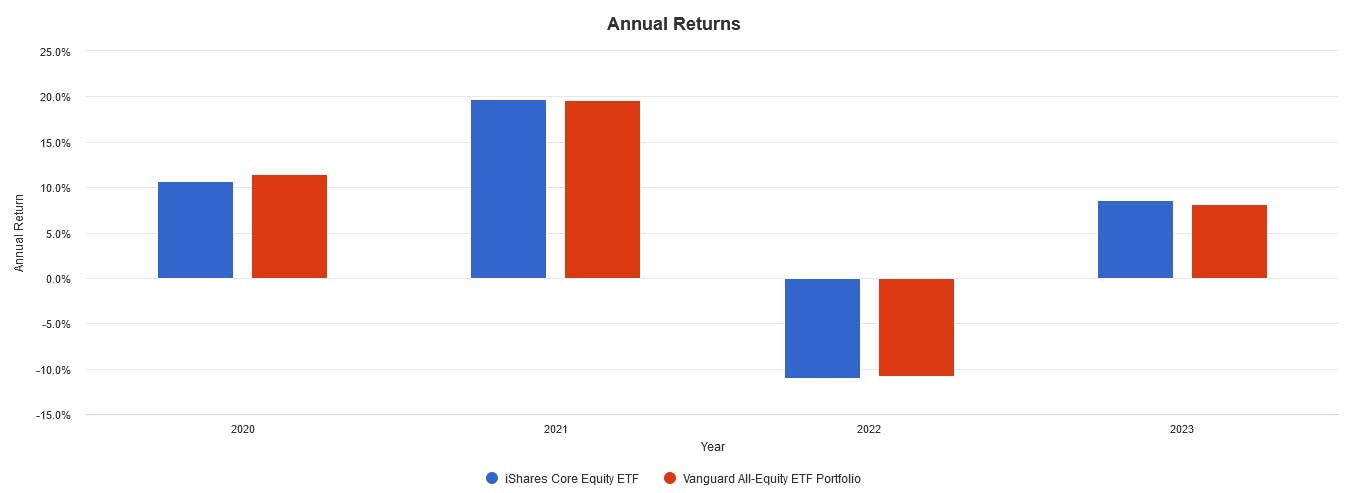
Keep in mind that this backtest is hypothetical in nature, does not reflect actual investment results and is not a guarantee of future results. It also does not account for trading commissions and bid-ask spreads.
As expected, VEQT and XEQT have performed similarly since January 2020, with virtually identical returns, volatility, drawdowns, and Sharpe ratios. Any small differences are likely due to discrepancies in geography weightings and expense ratios (XEQT charges 0.20%, while VEQT charges 0.24%).


My verdict? It's a coin flip. Both ETFs are low-cost, passively managed, run by reputable ETF managers, and offer high diversification. Agonizing over these minute differences won't matter for most self-directed investors, especially over the long term.
Another possibility is to use VEQT as a tax-loss harvesting pair for XEQT and vice-versa to avoid the CRA's superficial loss rule. However, it's always a good idea to consult a licensed financial planner or tax attorney before trying to do so.
This content was originally published by our partners at the Canadian ETF Marketplace.
