- S&P 500 now within 1% from record and NASDAQ added 4 records last week
- Gold also at record highs, and yields near record lows
- Dollar may surprise with reversal taking gold down
- Oil confuses traders
Conflicting themes that were in evidence during Friday's trade will continue to play out in markets over the coming week. Tech shares dropped as President Donald Trump escalated his campaign against China, while at the same time the monthly US jobs report beat estimates and provided a boost for small cap, domestic US firms.
Tech Sells Off As Domestically-Focused Small Caps Gain
The White House's recent moves against China picked up steam late last week, with Trump issuing executive orders on Thursday evening, aimed at barring TikTok and WeChat usage in the US. On Friday the administration put out sanctions against Hong Kong's leader, Carrie Lam and 10 other officials. The moves spurred Friday's NASDAQ Composite drop.
The tech heavy index closed down 0.9% for the day, paring weekly gains to 2.4%, as behemoths such as Apple (NASDAQ:AAPL), Microsoft (NASDAQ:MSFT) and Amazon (NASDAQ:AMZN) were sold off during the final day of trade. Conversely, smaller domestic companies such as banks, manufacturers and utilities pulled up the Russell 2000.
Investors will continue to monitor developments of a political deal to extend the government's coronavirus relief package. So far Congressional lawmakers remain deadlocked on the size and breadth of the stimulus. As a result, President Trump issued a series of executive orders on Friday night to stop evictions and possibly restore some unemployment assistance, though the efficacy of the presidential orders isn't immediately clear.
On a weekly basis, all four major US indices—the S&P 500, Dow Jones, NASDAQ and Russell 2000—rose for the week.
The S&P, already above pre-COVID-19 levels, closed a mere 1% away from its Feb. 19 record on Friday. The NASDAQ added a fresh record every day during the past week, except on Friday when it dropped.
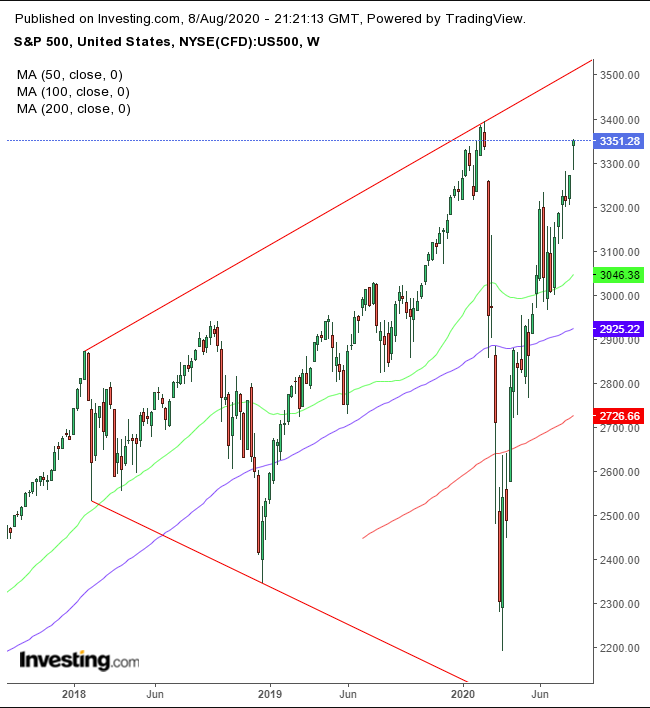
While it’s true the SPX has been in an uptrend since the March bottom, it has been trendless since January 2018, having produced higher highs, but at the same time lower lows. This created a broadening pattern, visible in the chart above.
Historically, this trading pattern tends to develop at market tops, since it indicates, in an overall sense that investors have lost their way. However, this pattern is generally produced during several months or over the course of a year. Astonishingly, this particular broadening pattern has been growing for over 30 months, which is unprecedented.
Since there is no additional technical situation that's similar, we have no statistics on which to rely. Plus, to be honest, we also can’t claim to know that the same market dynamics that motivate a normal megaphone pattern will permeate this extraordinarily long one.
As such we can't even begin to predict what might happen next. Either, this pattern has been in effect for so long it doesn’t necessarily mean investors can’t make up their minds, or perhaps they've already made their decisions over sufficient durations but then also rethought their positions during other periods.
Another possibility: given this megaphone is significantly larger than the regular version of this pattern—and the same dynamics do in fact apply—it could, ultimately, pack in that much more of a punch.
The test will be whether it makes a higher high, followed by a higher low, and then yet another high, to establish a long-term uptrend. If that occurs, we will become unabashed bulls—and the hell with the fundamentals, which have long been out of whack in this QE economy.
The NASDAQ Composite is a more complex study.
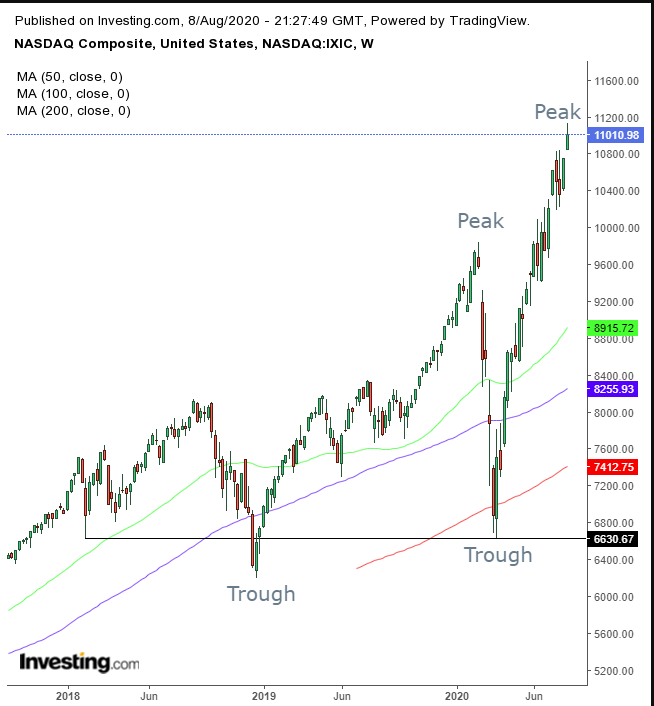
While, officially, it developed two rising peaks and troughs since the December 2018 bottom, its highs were much more impressive, while its troughs have been relatively flat, creating the possibility of a massive, Complex H&S top.
Though stocks are now generally above their pre-coronavirus levels, the VIX is not.
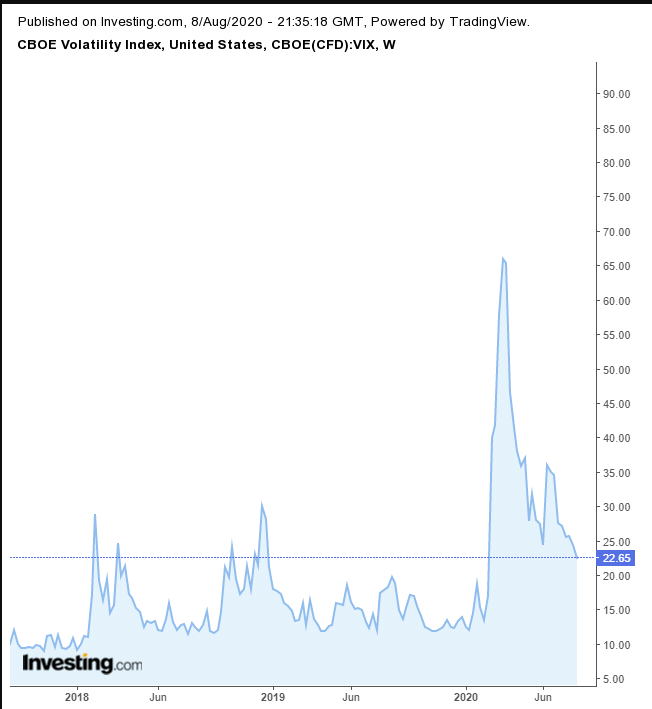
In fact, the only time the 'fear' index was as high as it is now happened amid the sharp selloffs depicted in our equity charts above. We consider this a negative divergence, which bolsters the argument that everything is not as dandy as equity bulls like to think.
Further buttressing that perspective: after Wednesday's ADP employment release severely missed estimates, Friday's better-than-expected NFP figure may paint a picture of a recovery for some, albeit not one that's V-shaped. Still, even with the addition of 1.8 million new jobs in July, the US economy is still 13 millions jobs short because of the pandemic.
Moreover, while it may have been the third month in a row of job growth improvement after the lockdown during the spring gutted the country's labor market, fewer jobs were created in July versus the 4.8 million new jobs posted in June, which paints a picture of a slowing recovery, at least on this metric.
Similarly, while the unemployment rate improved—falling to 10.2% from the 14.7% peak in April—by this measure more than 1 in 10 Americans still can’t find work.
Yields, including for the 10-year Treasury note, provide another negative divergence to stocks.
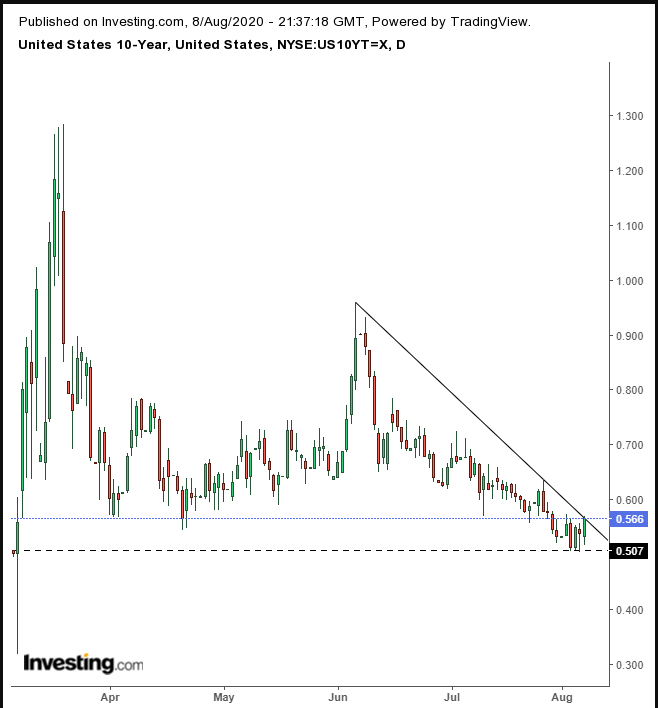
Rates remain subject to a downtrend, though they continue to hover above the March record low.
Finally, gold has been hitting record after record. That's another negative divergence to stock exuberance, as indices near or are posting their own records.
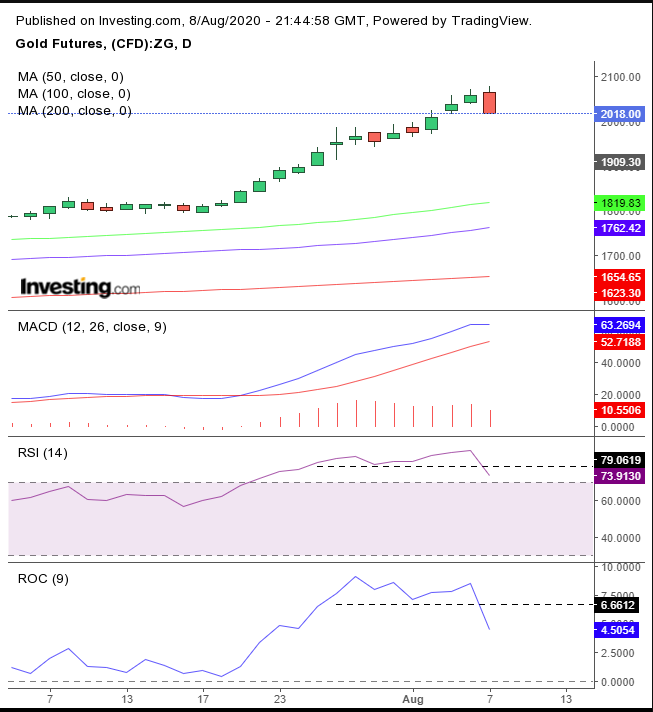
Since the yellow metal began hitting new records, we've been warning that a pullback is likely. Friday’s Bearish Engulfing pattern that swallowed two days of gains—along with topping momentums (though the lagging MACD has yet to provide a bearish cross)—reinforces our call for caution given this has become a market that is one-sided and bullish, causing investors to think that gold cannot fail them.
In the aftermath of the 2008 crash, the precious metal nearly halved in value.
Though gold has reached new heights, at the same time a dollar selloff brought the global reserve currency to a 2-year low.
Fundamentally, the current narrative says the economic downturn, with its higher levels of government spending and near-zero interest rates, is likely to continue to push the USD lower. However, all this is also true for every other currency in the Dollar Index basket as well.
In addition, markets can’t sustain record highs for both equities and gold for a long period of time. Something's got to give.
From a technical perspective, the dollar found support at the bottom of a rising channel since 2009.
Oil continues to defy expectations after its historic crash to -$40.
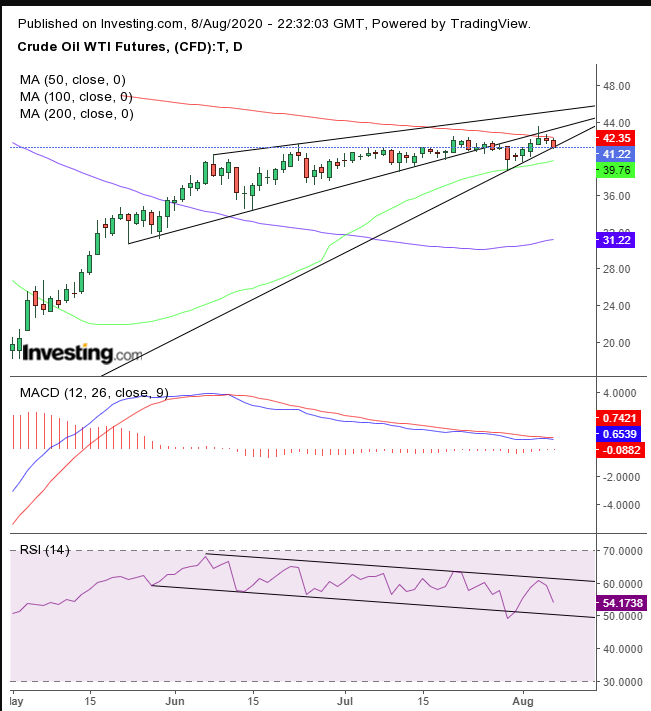
While Wednesday’s new high, above $43, demanded to be included into the rising trendline, it developed a bearish shooting star, which found resistance by the 200 DMA, confirmed by the following two sessions during which the price fell. In addition, preceding trading developed a rising wedge which would have been bearish if followed by a downtrend.
However, following an uptrend, it’s just confusing. Meanwhile, the price is squeezed between the 200 and 50 DMAs, as both the MACD and the RSI trail lower.
Up Ahead
All times listed are EDT
Monday
10:00: US – JOLTs Job Openings: expected to fall to 4.910M from 5.397M previously.
Tuesday
4:30: UK – Claimant Count Change: seen to surge to 250.0K from -28.1K.
5:00: Germany – ZEW Economic Sentiment: expected to edge down to 58.0 from 59.3.
8:00: US – EIA Short-Term Energy Outlook: offers a near-term perspective on energy markets.
8:30: US – PPI: probably jumped to 0.3% from -0.2%.
22:00: New Zealand – RBNZ Interest Rate Decision: the central bank is anticipated to hold rates steady at 0.25%.
Wednesday
2:00: UK – GDP: forecast to have plunged to -20.9% from -2.2% QoQ and dived to -22.5% from -1.7% YoY.
8:30: US – Core CPI: seen to remain flat at 0.2%.
10:30: US – Crude Oil Inventories: last week's reading showed a drawdown of-7.373M.
20:30: Australia – Employment Change: predicted to drop to 40.0K from 210.8K.
Thursday
8:30: US – Initial Jobless Claims: came in last week at 1,186K.
22:00: China – Industrial Production: expected to edge lower to 4.7% from 4.8%.
Friday
8:30: US – Core Retail Sales: anticipated to plunge to 1.6% from 7.3%.
8:30: US – Retail Sales: the headline number looks to have fallen to 1.8% from 7.5%.
