- S&P 500 hovering above monthly low
- Yields fall to 6.5 week low
- Gold posts third weekly advance; Bitcoin falls for the sixth straight day
- Oil stuck below $40
Rising evidence of the much-feared, COVID-19 second wave hammered US equity markets on Friday and will likely continue to weigh heavily on global and local financial markets during the upcoming week. All four major US indices—the S&P 500, Dow Jones, NASDAQ and Russell 2000—slumped, each dropping more than 2% on the day.
On Saturday, the US saw a record number of new coronavirus cases reported, 44,782. It was the second day in a row that the American new case count topped 40,000. In response, a number of states that had previously begun reopening, or were never fully closed, announced they were pausing or slowly shutting down.
During the final day of trade, Treasurys rose to a 6.5 week high and the dollar gained.
Pandemic, Facebook, Banks Pressure US Indices
After the escalating case count was publicized, the governors of two of the hardest hit states announced new measures: the governor of Texas expressed regret for reopening bars and restaurants so quickly and rolled back the reopenings; Florida's governor said Miami-Dade county beaches would be closed for the coming weekend's Fourth of July holiday.
Will other states follow, as the pandemic accelerates across the southern US? It‘s noteworthy that both governors are Republican and had previously scoffed at implementing health measures which would have been contrary to President Donald Trump’s desperate move to minimize the effects of the contagion and instead restart the US economy ahead of the US election which is only four months away. It’s also noteworthy that Florida is crucial swing state for incumbent.
The S&P 500 plunged 2.4% after news of the halt to reopenings broke.
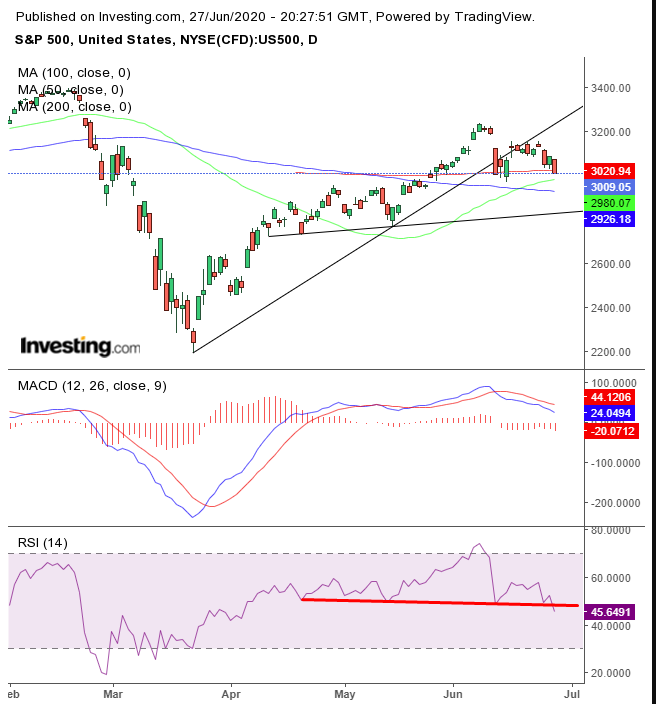
The broad benchmark fell to a two-and-a-half week low. An additional 0.24% drop would bring the SPX to a monthly low.
From a technical perspective, the index has been showing signs of weakness. It's unable to climb back above its broken uptrend line and make new highs, potentially forming a H&S top. In addition both the MACD and RSI are now bearish.
The broader market slide was exacerbated by an expanding advertiser boycott of Facebook (NASDAQ:FB), an effort organized by civil rights groups protesting the social media giant's refusal to remove hate speech from the platform.
Finally, shares of big banks plummeted after the Federal Reserve, citing coronavirus fears, restricted dividend payouts and buybacks. The results of its annual stress test, released Thursday, showed, "U.S. banks are strong enough to withstand the crisis and [the Fed] restricted dividend payouts and buybacks to make sure they stay that way. found that some banks could be too close for comfort to minimum amid the worst pandemic in a hundred years."
The index lost 3% for the week, even as consumer spending surged 8.2%, a new record, made more notable as virus cases increased as well over the same period. The fact that Americans were likely spending government relief payments may mitigate the significance of the data, since it may not represent the spending of funds earned by consumers.
As the old adage notes: “easy come, easy go.” On that score, personal income plummeted, from last month's 10.8% to well below the estimated -6.0%, actually hitting -4.2%.
The selloff comes after investors have been ignoring pandemic risks for weeks now, hoping instead for a V-shaped economic recovery, something that continues to seem less and less probable.
Yields, including for the US 10-year Treasury, fell to 6.5 week low, developing below the 50 DMA for a full daily session, for the first time over the same time-period.
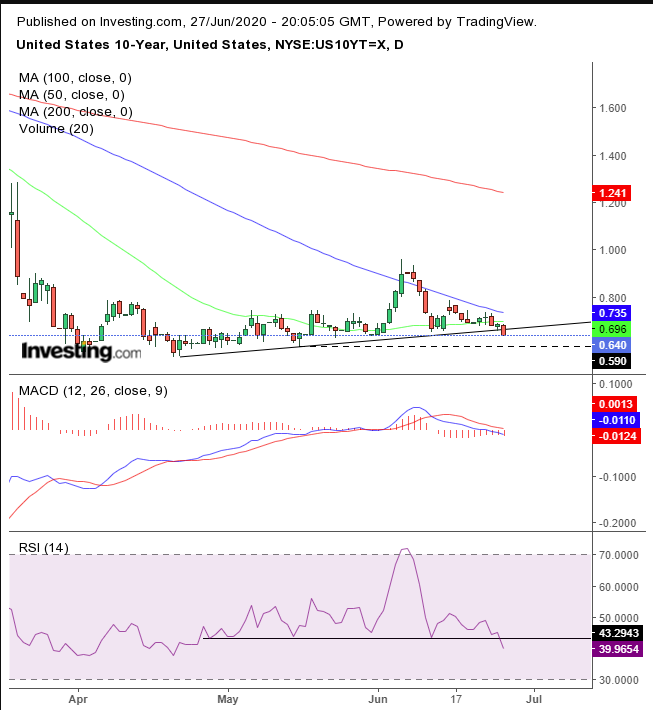
The 100 DMA provided a greater resistance than the 50 DMA, while the 200 DMA loomed far above. The next test is the hammer of June 15.
The dollar trimmed losses from its drop on Monday and Tuesday.
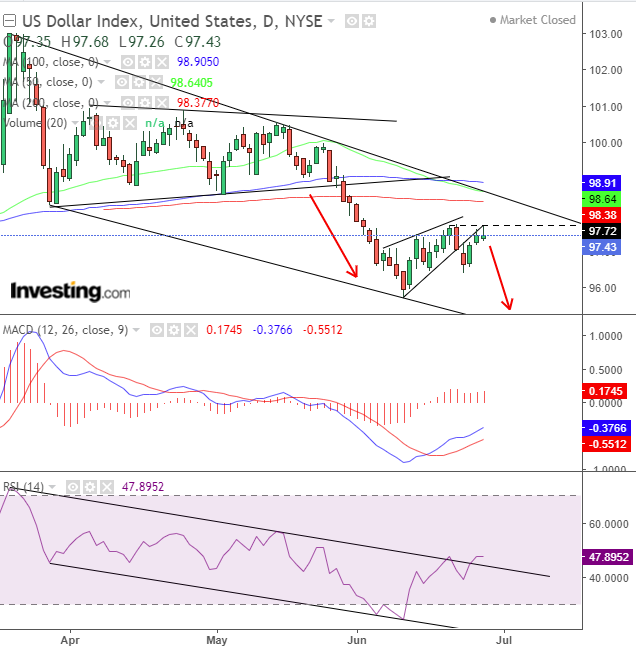
Chart powered by TradingView
It climbed to just 0.2% from its previous drop over the following three days. Friday’s intraday high found resistance by the June 19th high of the rising flag, completing a return-move. Even the 4-basis point yield drop, on an increase in Treasury demand, wasn’t enough to push the dollar above the flag’s supply.
The MACD turned bullish and the RSI broke above its falling channel. We’re still betting on the price’s falling channel, as well as the falling flag.
Gold rose 1.5% for the week, its third weekly advance and its longest up-move since January.
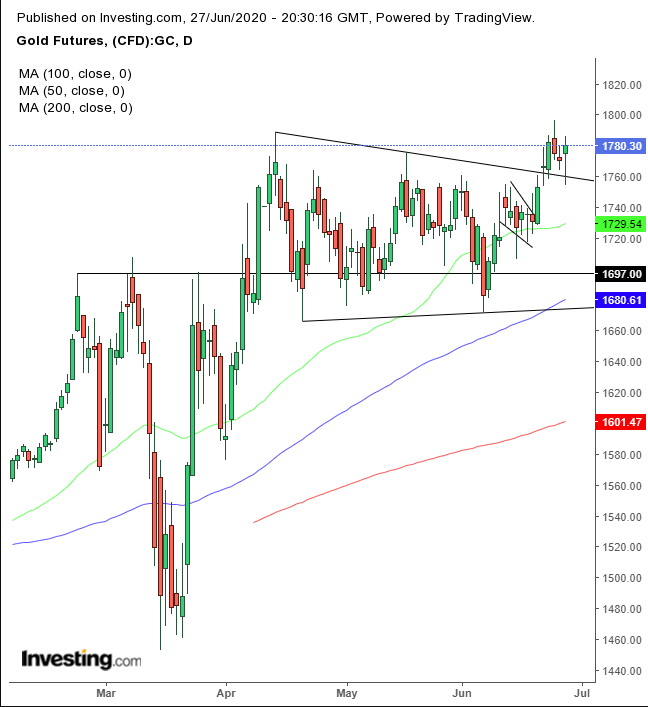
Recently, the precious metal broke free of both a falling flag and a symmetrical triangle, following a H&S continuation pattern, and was due for a pullback. After bouncing off its rising channel since June, it could be ready to resume its ascent.
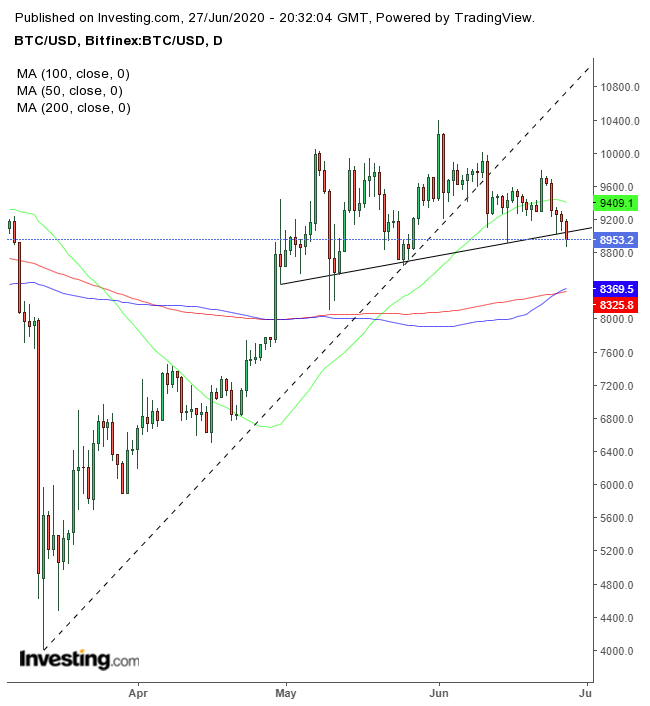
Bitcoin fell for the sixth straight day. On Saturday, it closed below our interpretative neckline of a H&S top.
Oil continued to trade below $40.
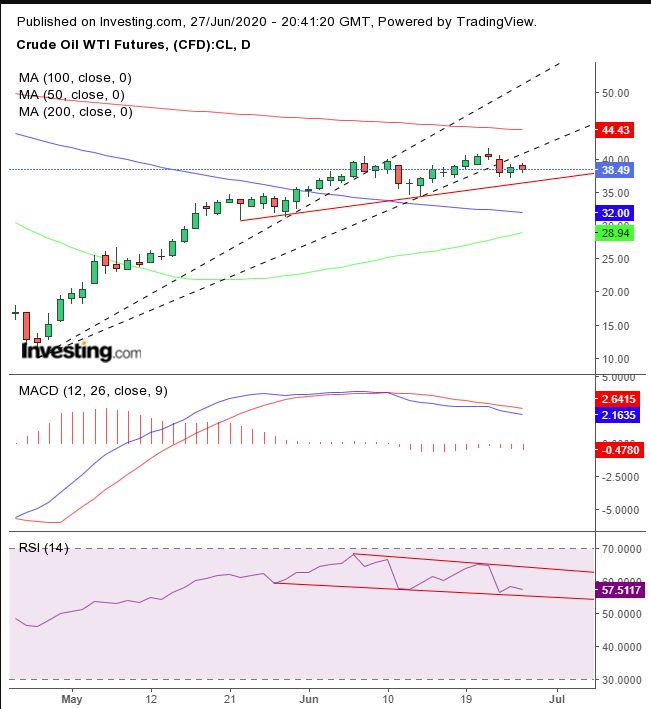
The commodity slipped 0.6% on Friday, registering an overall 3.2% decline for the week, even after Russia gutted exports of its flagship crude Urals to the lowest in at least a decade. Technically, WTI may be topping out below the 200 DMA, with both MACD and the RSI providing negative divergences.
The Week Ahead
All times listed are EDT
Sunday
19:50: Japan – Retail Sales: expected to 'recover' to -11.6% from -13.9% previously.
Monday
10:00: US – Pending Home Sales: seen to surge to 19.7% from -21.8%.
21:00: China – Manufacturing PMI: anticipated to edge down to 50.4 from 50.6.
Tuesday
2:00: UK – GDP: probably remained flat at -1.6% YoY and -2.0% QoQ.
5:00: Eurozone – CPI: looks to remain steady at 0.1%.
8:30: Canada – GDP: forecast to further decline to -12.0% from -7.2%.
10:00: US – CB Consumer Confidence: likely to have climbed to 91.6 from 86.6.
19:50: Japan – Tankan Large Manufacturers Index: predicted to have dropped to -31 from -8.
19:50: Japan – Tankan Large Non-Manufacturers Index: expected to slumped to -18 from 8.
21:45: China – Caixin Manufacturing PMI: seen to edge down to 50.5 from 50.7.
Wednesday
3:55: Germany – Manufacturing PMI: probably stayed steady at 44.6.
3:55: Germany – Unemployment Change: expected to halve to 120K from 238K.
4:30: UK – Manufacturing PMI: anticipated to have remained flat at 50.1.
8:15: US – ADP Nonfarm Employment Change: forecast to soar to 3,000K from -2.760K.
10:00: US – ISM Manufacturing PMI: expected to rise to 49.0 from 43.1.
10:30: US – Crude Oil Inventories: printed at 1.442M last week.
14:00 – FOMC Meeting Minutes
Thursday
8:30: US – Nonfarm Payrolls: predicted to have gone up to 3,074K, up from 2,509K.
8:30: US – Unemployment Rate: expected to edge down to 12.3% from 13.3%.
21:30: Australia – Retail Sales: anticipated to jump to 16.3% from -17.7 percent.
Friday
4:30: UK – Services PMI: like other UK data, expected to remain steady at 47.0
