- Friday's stock pull-back signals strong investor uncertainty
- Traditional havens such as yields, yen, gold rise
- Economic data will begin pouring in showing coronavirus devastation, including unemployment and consumer sentiment
Though stocks pulled back during the final hour of trade on Friday to finish the day lower, U.S. equities enjoyed their best rebound in over a decade during the course of the week, as risk appetite appeared to have returned to markets. Of course, that could simply be a short-term development fueled by Congress passing the biggest spending bill in the country's history, finalized on Friday and designed to help compensate workers and companies for the hefty economic hit from COVID-19.
Still, a measure of U.S. consumer confidence released on Friday, the Michigan Consumer Expectations fell the most since 2008. At the same time, West Texas crude oil slumped, resulting in a fifth straight week of losses. And the dollar had its worst five-day skid since 2009.
No surprise then that safe havens such as the Japanese yen and gold rose.
Gains Don't Necessarily Signify Optimism
Even after a sudden plunge in the last hour, the S&P 500 gained 10% for the week, its biggest advance since March 2009, thanks to the record three-day rally. The Dow Jones Industrial Average, which fell around 4% on Friday, still had its best week since 1938, even after 28 of the mega cap index's 30 components were sold off during the final day of trade.
Nonetheless, the overarching emotion isn't one of optimism: the fact that even after the biggest multi-day rally in quite some time investors are still terrified to hold a variety of assets over the weekend—a period of time when they'd be unable to sell shares if the coronavirus news worsens—illustrates just how uncertain market participants remain.
With over 666,000 cases reported globally at time of publication, the United States, where almost 125,000 cases have been reported at the time of writing, is now considered the epicenter of the outbreak; the fatality rate there just reached 2000. The virus has slowed the U.S. economy significantly as large swathes of the country are in lock-down to slow the spread of the infection. It's just a matter of time until upcoming economic metrics, generally trailing indicators, reflect current geopolitical events.
Thus, despite last week's big equity advances, we maintain our bearish stance going forward.
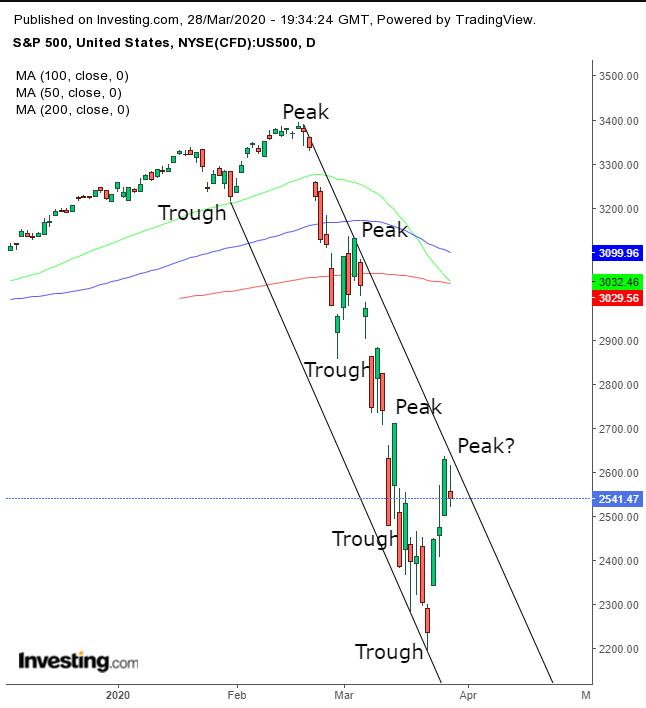
Technically, as can be seen in the SPX chart, the benchmark's climb was a corrective rally within a descending channel. The price fell back after reaching its top.
Fundamentally, Friday's selloff during the final hour of trade can't be ignored. The fact that even after an unprecedented, $2 trillion fiscal rescue package was passed, investors aren't feeling comfortable enough to retain their risk assets over a three-day period, should be considered a significant red flag.
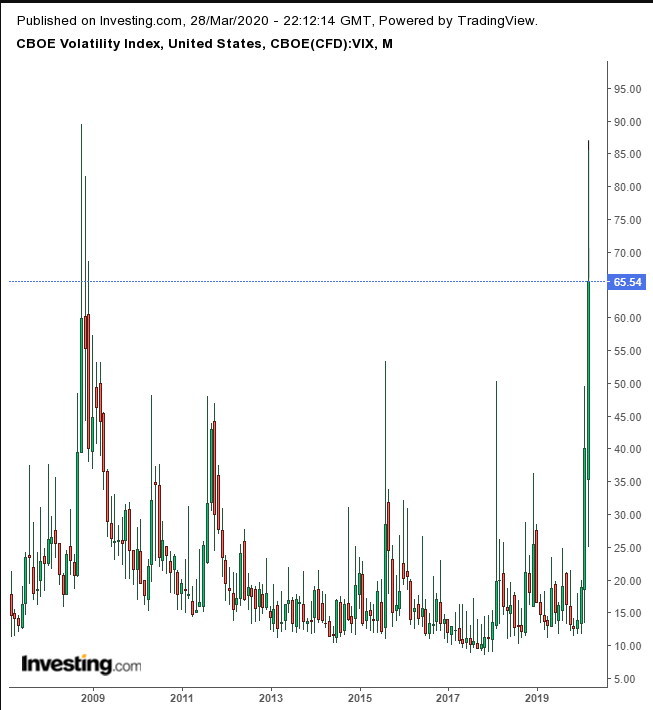
Another indication investors don’t expect markets to sail smoothly back to record highs, the CBOE Volatility Index is on track for a 10th straight close above 60. That's the highest level for the so-called 'fear index' since October 2008. As well, if the VIX closes at these levels on Tuesday, it will set a new record for the highest monthly volatility since the gauge was launched in the early 90’s.
An additional sign that should give investors pause: yields fell, wiping out the preceding week’s gains.
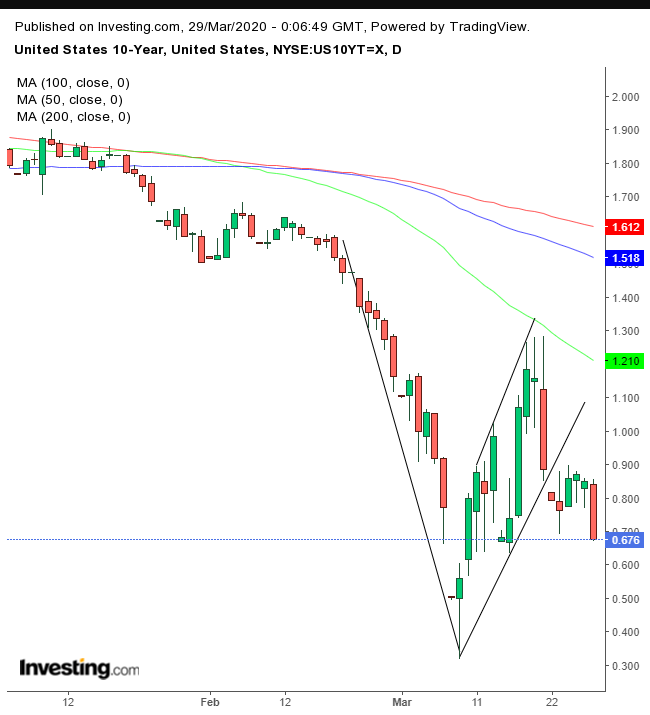
Yields for the U.S. 10-year Treasury fell to their lowest close since March 9, which had bounced back from the benchmark note's lowest level ever on March 8. Friday’s plunge back below 0.7% signals the end of a return move to a rising flag, bearish after the preceding drop from 1.6% to 0.3%
Also, though the USD/JPY and gold each advanced for the week, their rise of both safe haven assets took place alongside U.S. dollar weakness, which makes it difficult to determine how much of the climb for each of the havens was due to hedging against rising equities versus simply the result of USD weakness.
That said however, the yellow metal advanced against every major currency, including the tradional safe haven yen and Swiss franc, reclaiming its precious metal designation.
After years of being considered the ultimate safe haven, the U.S. dollar experienced its worst five-day selloff since 2009.
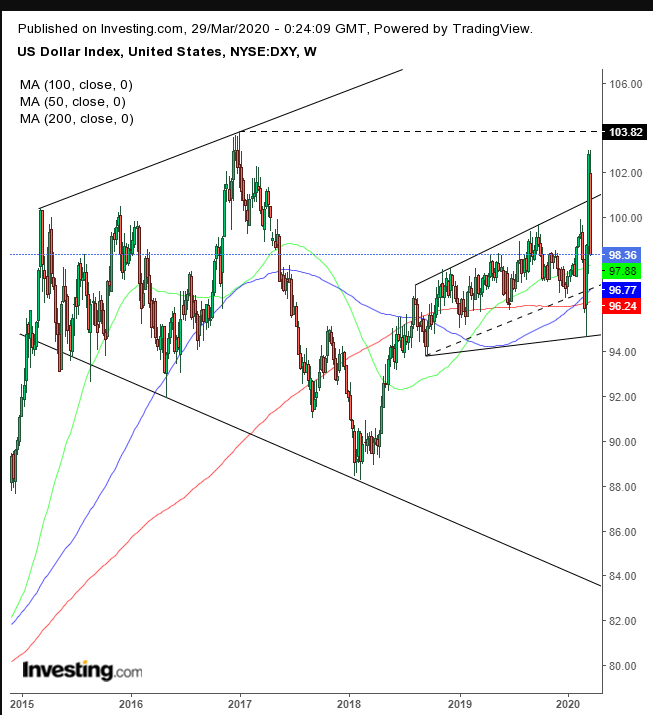
Based on the global reserve currency's technical chart, it's clear traders have no idea where the greenback might be headed next. The dollar is now trapped within a broadening pattern, which occurs when there's a lack of market leadership. As well, the pattern has a tendency to develop at market tops.
Oil also fell, for a fifth straight week of declines.
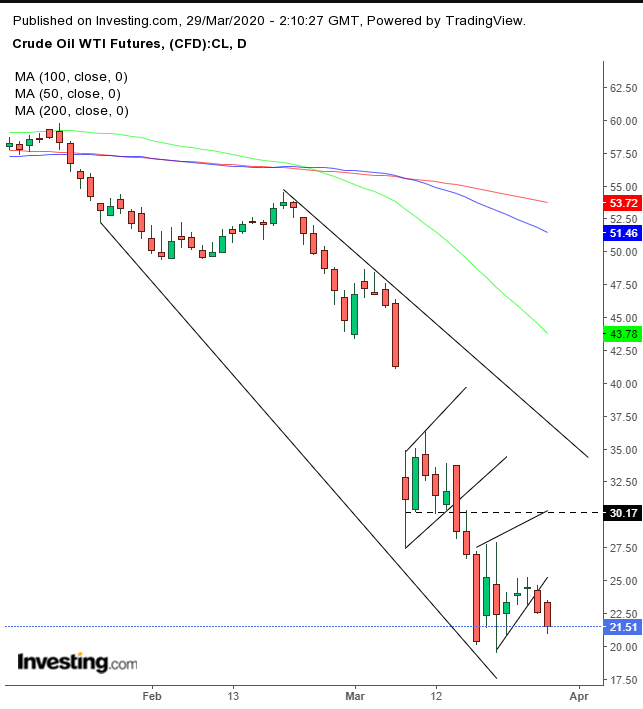
Despite our expectation that the commodity would bounce toward $30 before falling below the $20 line, as it trades along a bearish pattern, it appears to be too weak to even develop a proper rising flag.
Week Ahead
All times listed are EDT
Monday
10:00: U.S. – Pending Home Sales: expected to plunge to -1.0 % from 5.2%
21:00: China – Manufacturing PMI: anticipated to have risen to 45.0 from 37.5 the month previous.
Tuesday
2:00: UK – GDP: Seen to remain flat at 1.1% YoY, while declining to 0.0% growth from 0.5%.
3:55: Germany – Unemployment Change: predicted to surge to 28K from -10K previously.
5:00: Eurozone – CPI: probably fell to 0.8% YoY in March, from 1.2%.
8:30: Canada – GDP: expected to have declined to 0.1% in January, from 0.3% at the end of 2019.
10:00: U.S. – CB Consumer Confidence: seen to drop to 112.0 in March from 130.7.
19:50: Japan – Tankan Large Manufacturers Index: to plunge to -10 from 5.
21:45: China – Caixin Manufacturing PMI: anticipated to rise to 45.8 from 40.3
Wednesday
3:55: Germany – Manufacturing PMI: expected to edge down to 45.4 from 45.7.
4:30: UK – Manufacturing PMI: seen to slightly slow to 47.0 from 48.0.
8:15: U.S. – ADP Nonfarm Employment Change: forecast to plummet to -154K from 183K.
10:00: U.S. – ISM Manufacturing PMI: likely to have contracted to 45.0 from 50.1.
10:40: U.S. – Crude Oil Inventories: previous print was 1.623M barrels.
Thursday
4:30: UK – Construction PMI: February's reading of this key measure was 52.6.
8:30: U.S. – Initial Jobless Claims: expected to continue freefalling to 3,000K from last week's record 3,283K.
Friday
8:30: U.S. – Nonfarm Payrolls: seen to plunge to -100K from 273K.
8:30: U.S. – Unemployment Rate: expected to rise to 3.9% from 3.5%.
10:00: U.S. – ISM Non-Manufacturing PMI: probably tumbled to 44.0 from 57.3.
