- Markets back to normal; Treasurys return to negative correlation with equities
- Volatility bets, the biggest driver of the equity selloff, expected to be mostly over
- Major Indexes, except Russell 2000, remain in clear uptrends
Based on Friday's Treasury sell-off and the rotation back into equities during the final day of trade last week, we believe the financial markets are recalibrating. The stock market selloff seen earlier in the week is probably a correction that has mostly run its course.
In our view, stocks are now set to retest recent all-time records and yields will challenge seven-and-half-year highs. The dollar is likely to top-out while oil will resume its upward ascent, taking on its near-$77 recent high.
Rising Rates, Roiling Trade War Or Something Else?
Stocks posted their best performance in six months on Friday—the S&P 500 and Dow each gained significantly. However, it was the NASDAQ Composite that outperformed, as traders rotated back into tech shares, taking advantage of the deepest dip in technologies since March.
Equity market trade was particularly volatile, as stocks gave up early gains. According to JPMorgan estimates, stocks finally tracked higher, and kept their profits, only after 70 percent of the computer-driven trading strategies were played out. While the market narrative dictated that last week's steep declines—the most extended sell-off in six months—were fueled by concerns about rising interest rates, with ongoing trade war concerns which would act to stifle growth as a backdrop, the reality was probably something different. The biggest selling pressure on markets this past week came from options related to changes in volatility levels.
Put simply, the equity sell-off was provoked by traders unwinding positions as they restructured their portfolios, recalibrating along with the sudden shifts in the market dynamic, rather than because of a loss of faith in growth. This contradicts Morgan Stanley, whose analysts reported Wednesday that the market might have reached a "tipping point," with spiking yields likely to prompt a sector reallocation, from growth to value assets.
Morgan Stanley went even further, predicting a market correction as early as 2019, sooner than most analysts anticipate. This pessimistic view followed the International Monetary Fund's (IMF) outlook. The organization cut its expectations for US growth partly due to the US-Sino trade dispute and the fact that some companies issued profit warnings.
How, then, should traders proceed? We try to avoid second-guessing the market. We're cautious but remain alert to reversal signals. When both the fundamentals and the technicals support a continued bull market, we believe that should be taken at face value.
Sudden Volatility, Conflicting Technicals
The S&P 500 Index gained 1.42 percent on Friday, paring its weekly selloff to 4.1 percent. Technology (+3.21 percent) and Communication Services (+2.23 percent) were the clear outperformers. Utilities (-1.11 percent) underperformed. While all 11 sectors were deep into red on a weekly basis, down at least 1 percent, Materials (-6.73 percent) and Industrials (-6.37 percent) led the benchmark's losses for the week. Utilities (-1.27 percent) outperformed for the week.
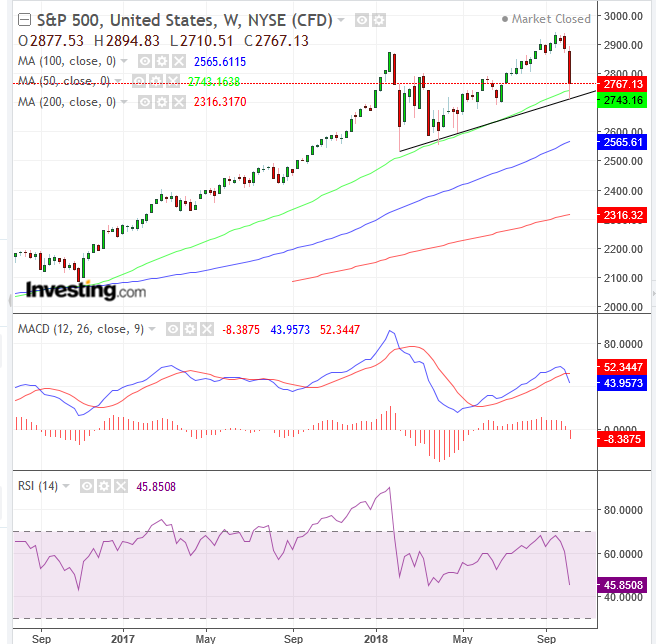
Technically, the index rebounded after bears attempted to pierce the uptrend line since the February low. As well, the SPX scaled back above the 200 DMA, after plunging below it on Thursday, and the daily RSI rebounded from its most oversold level since August 2015.
On the weekly chart, the price found support by the 50 WMA, but the RSI provided a negative divergence as it's retesting its previous trough, and the MACD provided a sell signal, after its shorter MA crossed below its longer MA. Conflicting technicals are expected during sudden volatility.
The Dow Jones Industrial Average climbed 1.15 percent on Friday, paring its weekly decline to 4.19 percent. Wall Street's mega cap benchmark is displaying similar technical dynamics to the SPX; only its weekly MACD has yet to provide a sell signal.
The tech-heavy NASDAQ Composite outperformed, jumping 2.29 percent. Its weekly setback was 3.74 percent. Despite being the leader of Friday’s rally, the benchmark is in a worse position than the S&P and Dow. Thursday’s vicious sell-off pushed the index below both its uptrend line since the February low as well as the June trough, in addition to the 200 DMA. The rally on Friday pulled its price back above all three—though barely. It now hangs at this level by its fingernails. As well, both the weekly MACD and RSI provided sell signals.
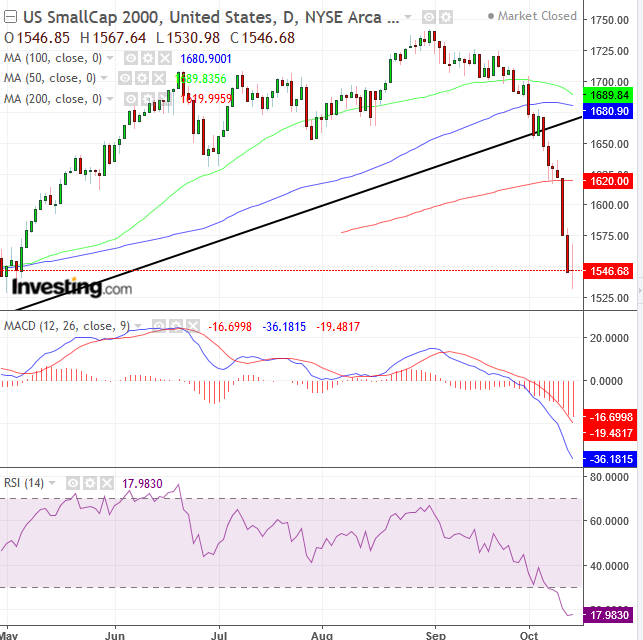
The Russell 2000 lagged, both on Friday when it gained only 0.1 percent, and for the week, shedding 5.23 percent of value. Having fallen below its uptrend line since the February bottom early in the month and below the 200 DMA back on Tuesday, it provides the weakest picture.
The underperformance of the Russell, compounded by its weak technicals, may be good news for large and mega caps, which have given up gains in favor of small caps throughout the trade war. However, traders should remain alert as stock market tops typically lead with small caps.
Much like sailors on sinking ships, first the junk is thrown overboard and small caps are inherently considered speculative. Still, we're not calling a top for the Russell till after its price forms a peak that's lower than the one seen in August.
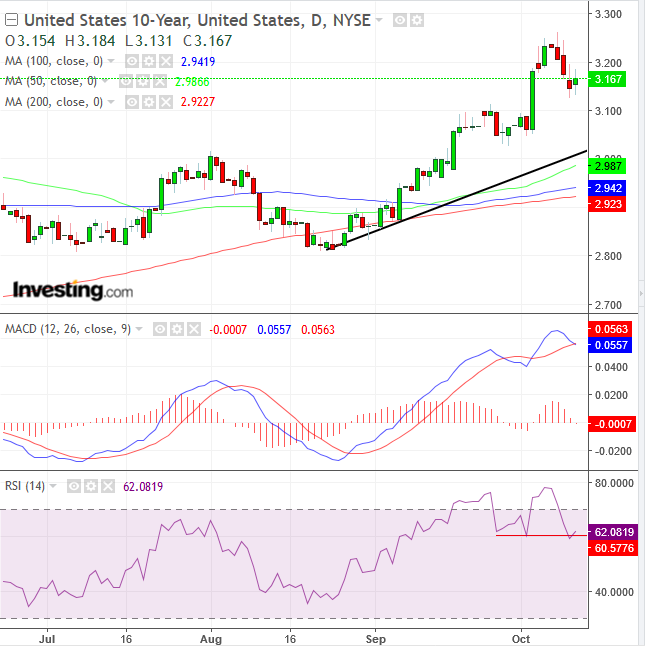
The 10-year Treasury fell in tandem with equities last week, raising concerns of a total loss of faith in financial markets as well as a top. However, we were relieved to see that at the end of the week investors had started buying Treasurys even as they were selling stocks, the normal order of behavior in financial markets. As well, Friday's equity rally coincided with a rise in yields, as Treasurys were sold off, demonstrating that once again, intermarket analysis makes sense.
Rates are still well above their uptrend line. While the MACD threatens to provide a sell signal, it's still holding, and the RSI, which slightly and temporarily fell below its recent trough, scaled back above it.
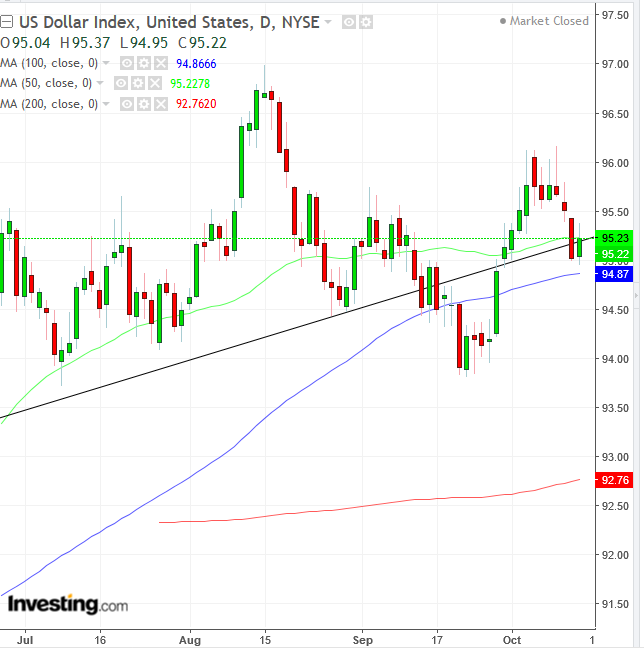
The dollar once again fell below its uptrend line since mid-June. On Friday it climbed back above it—albeit barely; the 50 DMA seemed to have formed a resistance. In addition, last week's sell-off formed a peak, lower than that seen in August. A trough lower than September's will have established a downtrend.
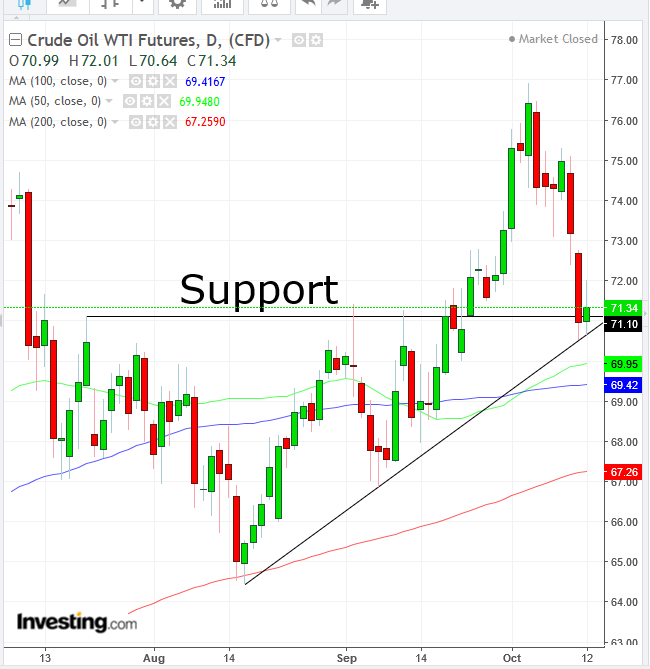
Oil took a nasty tumble last week, plunging more than 4 percent, deepening the commodity's pullback from the $76.90 peak seen two weeks ago. The main culprit is probably the market's general risk-off mood.
From a technical perspective, the price bounced off the uptrend since mid-August and the August-September support of high prices, and the 50 DMA crossed above the 100 DMA. Given all these signals, believe that prices are set to challenge the previous peak.
Week Ahead
All times listed are EDT
Monday
8:30: US – NY Empire State Manufacturing Index (October), Retail Sales (September): Empire index to rise to 20.40 from 19, while retail sales rise 0.7% MoM, from 0.1% last month.
21:30: China – CPI (September): forecast to rise 2.5% YoY and 0.7% MoM, from 2.3% And 0.7% respectively.
Tuesday
4:30: UK – Employment Data: August Unemployment Rate to hold at 4%, and Average Earnings including Bonus to rise 2.6% in August from 2.6% previous. September claimant counts to increase to fall to 4,500 from 8,700.
5:00: Germany – ZEW (October): economic sentiment to fall to -12.3 from -10.6.
Wednesday
4:30: UK - CPI (September): CPI to rise 2.6% YoY and 0.2% MoM, from 2.7% and 0.7%, while core CPI rises 2% YoY and 2.1%.
5:00: Eurozone – CPI (September): forecast to remain flat at 2.1% YoY.
8:30: US – Housing Starts and Building Permits (September): starts expected to fall by 4.5% from increasing 9.2 percent MoM, and permits to rise 1.280M from 1.249M.
10:30: US – EIA Crude Inventories (w/e 12 October): forecast to see a 2.620-million-barrel rise in inventories.
14:00: US – FOMC Minutes: the committee’s decision to raise rates will be revealed in more detail, providing volatility for the US dollar and equities.
19:50: Japan - Trade Balance (September): deficit to rise to -Y50 billion, from -Y438 billion.
22:30: Australia – Employment Data (September): September unemployment to hold at 5.3%, while 15,200 jobs were created from 44,000 last month.
Thursday
4:30: UK – Retail Sales (September): sales to remain steady at -0.3% MoM and rise 3.7% from 3.3% YoY.
8:30: US – Initial Jobless Claims (w/e 13 October): claims to fall to 210K from 214K.
19:30: Japan – CPI (September): CPI to rise 1.0% YoY from 1.3%, and core CPI to rise 1.0% from 0.9% YoY
22:00: China – GDP (Q3): QoQ growth to reduce to 1.6% from 1.8%, and YoY growth to fall to 6.6% from 6.7%
Friday
8:30: Canada – CPI, Retail Sales (September): CPI to be -0.1% MoM, in line with August, and 2.7% YoY from 2.8%, and core CPI to be 1.8% YoY from 1.7%.
10:00: US – Existing Home Sales (September): forecast to drop 0.3% from 0.0% MoM.
