
- Unless there is a huge CPI surprise, Fed is slated to raise rates by 0.5%
- The Fed could make a hawkish statement, which could rile markets
- There are two levels of market drivers: (1) tension between inflation and recession, and (2) focus between that tension and corporate earnings
- Earnings could improve amid the cheapening dollar and commodities
At a time when inflation is the determining factor of our economy, investors are eagerly awaiting Tuesday's CPI data. Unless the numbers are wildly off course, the Fed will not change its interest-rate path. Consensus has a 0.5% hike, after four hikes of 75 basis points each, and the fed funds target rate is at 3.75% to 4% after six rate hikes.
Economists see inflation at 0.3% and the core figure at 0.4%, compared with October's mirror-image numbers of 0.4% and 0.3%, respectively. (Core inflation excludes volatile energy and food prices, and is therefore a more representative gauge.) For the year, consensus calls for an inflation dip to 7.3%, compared with 7.7% YoY. If the data show prices rising at a pace that’s the same or higher than last year, we could see another jumbo 0.75% hike.
While this institution is too cumbersome to change its planned interest-rate hike between Tuesday's CPI and Wednesday's FOMC announcement, it could influence Fed Chair Jerome Powell's statement. The language he uses, and what he doesn't say, have often riled markets. As I have repeatedly demonstrated in the ups and downs amid the current downturn, investors grow optimistic or pessimistic about monetary policy according to the short-term trend. More recently, I've argued that the market is also influencing the Fed.
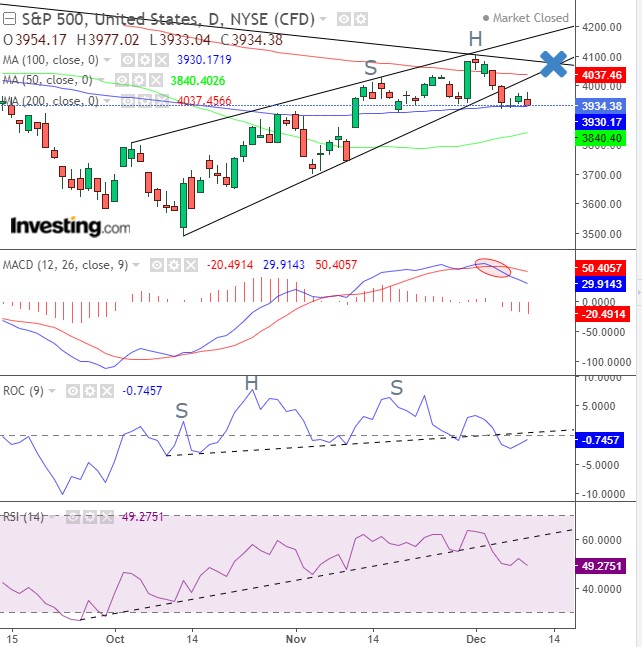
If that relationship between policy and the short-term trend continues, we should see the outlook growing bearish again, in correlation with another short-term selloff that syncs with the medium-term downtrend. Last week I reiterated my bearish view of the medium term and said that if the current short-term rally's rising wedge completes with a downside breakout, I expect the medium-term downtrend to resume.
Source: Investing.com
Sure enough, the S&P 500 fell below the rising wedge - a pattern in which bulls grow impatient as the price highs do not keep up with the increasing lows. However, the index found support by the 100 DMA, which means it could retest the wedge and the downtrend line since the record peak, forming a small head-and-shoulders pattern. The indicators provided bearish signals, and the rate of change (ROC) completed its H&S top. Caution: there are fake breakouts, and cautious traders will wait for a deeper price penetration confirmation.
However, if the CPI print is substantially lower than expected, it would almost certainly send the benchmark flying, quickly forming the right shoulder of the top - and it could even go higher than that, undoing the top.
10-year U.S. Treasury yields advanced Friday after the producer price index rose 0.3% in November, higher than the estimated 0.2%, which showed inflation is still hotter than expected. Since inflation was higher, while the Fed is expected to slow its path to higher rates, traders sold bonds, allowing their yields to rise. However, if the Fed starts talking up rates again, the focus will return to recession, in which case demand will increase for bonds, pushing the yield lower. A recession ushers in lower rates, rendering the current yields attractive again.

Source: Investing.com
Yields have gotten far above the main trendline since the March 20 low. They are now testing the year's trendline. If prices keep falling - as indicators suggest they should - they will test the April-to-August lows, which could be the neckline for an H&S top. At that point, the main trendline could support yields, pushing them back up for the right shoulder. The fundamental driver for these technical moves would be the back-and-forth focus between inflation and recession.
Still, there is a bullish counterargument. The weakening dollar and declining commodities could boost corporate earnings. Only time will tell which theme will be stronger: higher interest rates forcing the Fed to hike rates into a recession, or the corporate boost amid the cheaper dollar and commodities.

Source: Investing.com
After the dollar falls below the 200 DMA, will it find support at the nexus of the May resistance turned August support, 50 WMA, and uptrend line since the May 2021 low? Even if it does, it could simply be the making of an H&S top. Then, persistent inflation could force the Fed to keep raising rates, which would support the dollar.
Gold was flat for the week, befitting a significant resistance: the May-June support turned resistance in August - forming the neckline of a large H&S bottom - and the 200 DMA, which it has managed to cross for now.

Source: Investing.com
The smaller double bottom, completed in November, targets the 1,860 level. This suggests that the much larger H&S base might also be complete. That pattern's completion implied target would retest the $2,000 level.
Oil sold off in a rocky market, recording its sharpest weekly drop in months. The move came as the recession offset the chaos when the West dictated Russia's oil price, which could have disrupted supply.
At $71.50, oil has actualized about 75% of my $60 target from July, when the price was above $100. I've repeated a call at multiple points along the way, navigating the supply-and-demand trend's ups and downs.

Source: Investing.com
The price is testing the trendline connecting the lows since March 14, the potential falling channel bottom. The RSI is at 30, the most oversold level since December 2021, when the price had proceeded to surge 112% till the following March. I am not saying the price will repeat this same move, but it is ripe for a throwback. Even when the RSI reached 31 on Sept. 26, it bounced 22% - which could be a gauge for a potential corrective move within the downtrend.
Disclosure: At the time of publication, the author had no positions in the securities mentioned.