Global markets will likely take their cues at the start of this coming trading week from Friday's drop in risk assets after U.S. shares retreated from all-time highs on worries that an escalation in Middle East tensions would impede economic growth. Crude futures surged on the expected disruption of oil production that could result from such a scenario.
Safe havens, including Treasurys, the Japanese yen and gold all soared.
Investors Cash Out As Geopolitcal Headwinds Mount
The S&P 500 fell 0.71% on Friday, after a U.S. drone strike in Iraq killed Iranian Major General Qassem Soleimani. It was the steepest decline in a month for the benchmark, since the 0.86% drop on Dec. 2.
After Iran threatened “severe retaliation,” for the death of the powerful military leader, investors quickly rotated out of risk assets, driving havens to monthly highs. The tech-heavy NASDAQ and mega-cap Dow Jones slumped even more deeply, down 0.79% and 0.81% respectively.
The unexpected military strike—after months of unchecked Iranian aggression—was like an overinflated balloon being popped by a pin-prick. And it all occurred just when market participants began believing that everything seemed to be falling into place, with President Donald Trump scheduled, at long last, to sign the Phase I portion of a trade deal with China in early January.
Additional hopeful signals had spurred stocks to all time-highs prior to the military action: the PBoC cutting the reserve requirement in order support China's economy; global data showing signs of bottoming, after the Fed reversed policy and joined global central banks in accommodating. Nonetheless, on Friday, investors took the opportunity to cash out.
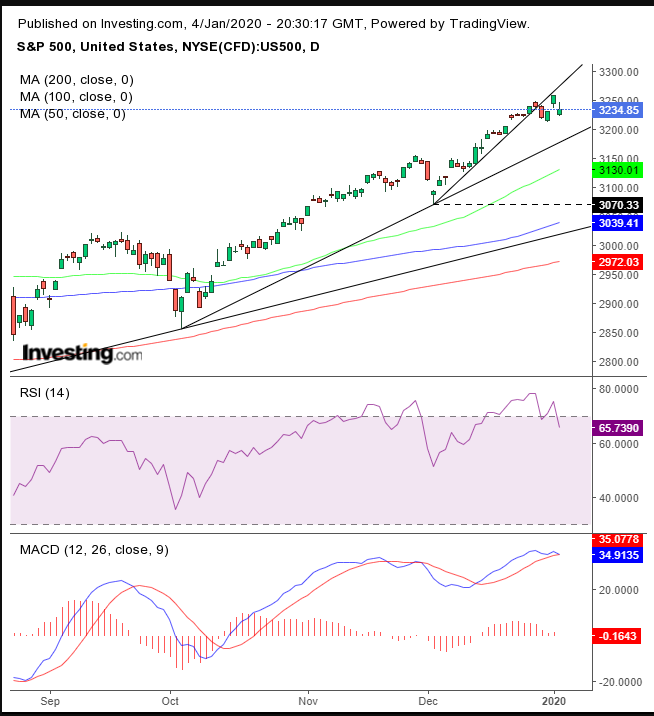
The S&P 500 slumped slightly for the week, ending a five-week rally, making this the second weekly breather within 13 weeks, since the September bottom.
Technically, Friday’s falloff from Thursday’s record high occurred after the benchmark hit the bottom of the broken uptrend line since Dec. 3. The RSI fell, even while the price reached a fresh record on Thursday, providing a negative divergence. The indicator also just topped out, providing two falling peaks and troughs, after reaching 78, the most overbought condition since January 2018.
The MACD’s short MA just penetrated the top of the long MA, as recent prices are weakening relative to the longer average.The indictors support the price’s fall below the uptrend line, suggesting it will test the previous uptrend line since Oct. 3, at the 3200 levels. And if that fails to support, the price will retest the uptrend line—probably at the 3070 level, coinciding with the Dec. 3 bottom, less than a 200-point, or 6% setback from the all-time high—since the infamous December 2018 bottom, after the worst Christmas Eve on record, when equities were an inch away from descending into a bear market.
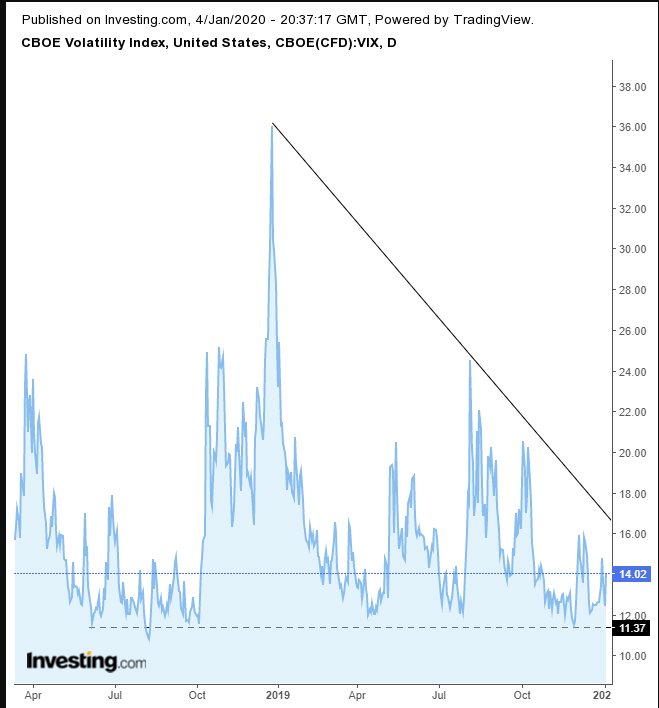
Plainly put, technicals suggest the market may have been lulled into complacency, as illustrated by the VIX which, toward the end of November was at its lowest level since August 2018. It's been climbing since. Will it return to the 20 level of October or the 25 seen during July or perhaps to the 36 which occurred during the December 2018 bottom?
Having provided the bearish argument, we are also aware that geopolitical events in and of themselves have proven in the past few years to have had only a temporary effect on the market. Thursday’s rally, after the New Year holiday, was among the strongest annual opens in a decade.
Still, for all the talk of fundamentals, the rally followed another round of Chinese stimulus plus momentum triggered by the positive news of last year’s stellar returns.
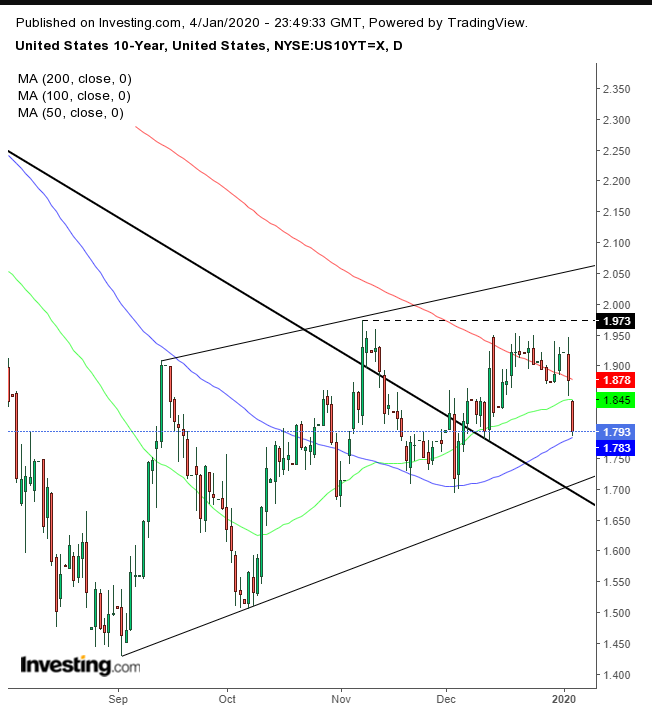
Yields, including for the benchmark U.S. 10-year Treasury, plunged 8 basis points to 1.799% from the recent high of 1.9%. This just one day after the 2-year / 10-year yield curve was the steepest since October 2018.
Technically, rates have dropped back below the 200 DMA, still stuck in a range they've been unable to break free from, above the 2.00 psychological level. They're wedged in a nexus between the long-term downtrend since the November 2018 high and the short-term uptrend since the September bottom.
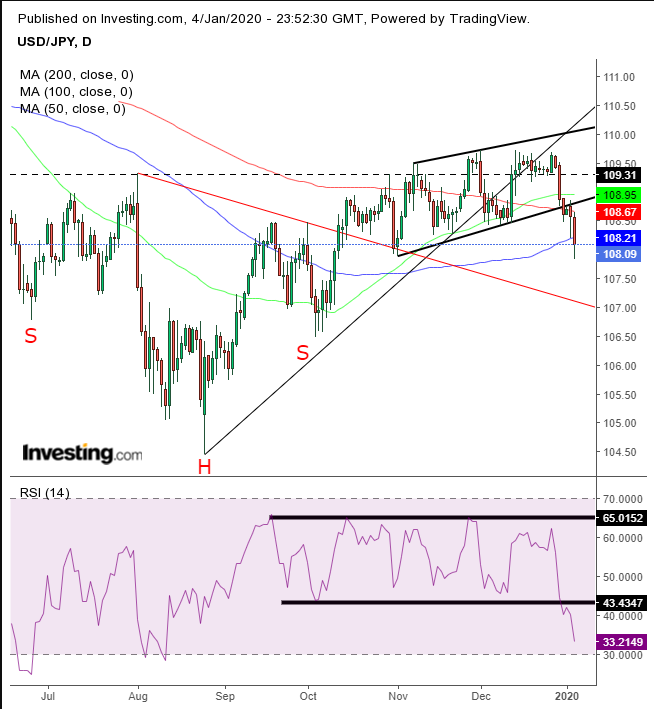
The yen leaped on Friday, pushing the dollar below its rising channel since completing a H&S bottom. The price is aiming to retest the neckline. For the same period, the RSI fell below its range.
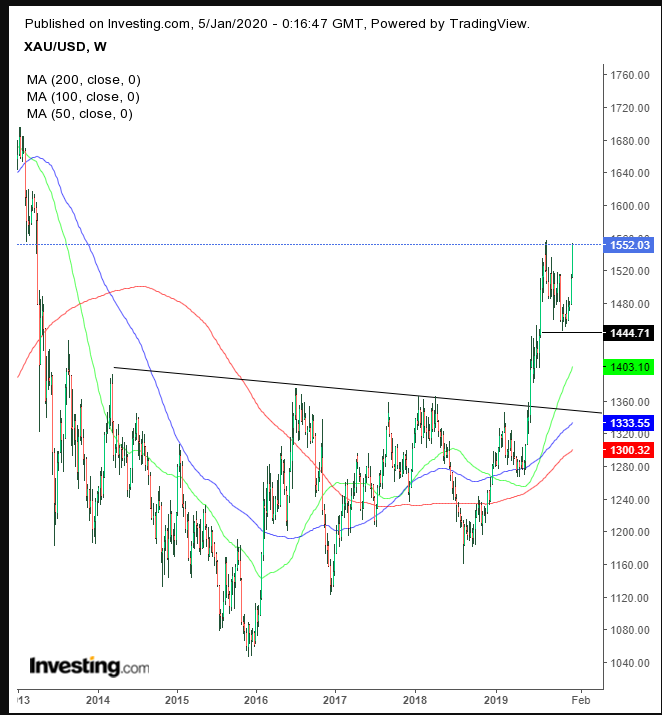
Gold jumped to 0.04% from the Sept. 4 close. This is the highest point for the commodity since the first week of April 2013. The yellow metal is resuming along the dynamics of the massive H&S bottom since 2013, as gold has become a win-win asset for traders.
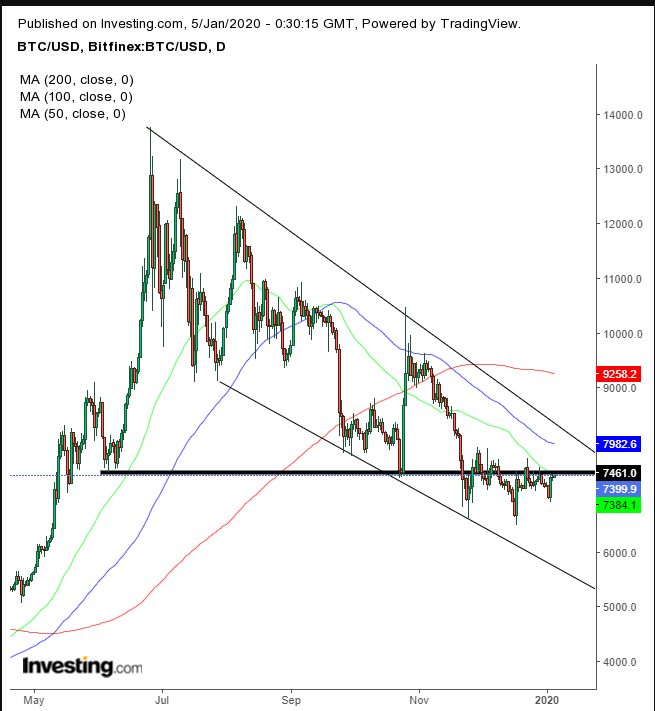
Despite a major geopolitical event, Bitcoin once again seems to be proving that it is not a reliable safe haven asset. The cryptocurrency has been unable to overcome the 7,460 level, a resistance in place since breaking the June 2019 support, as it remains within a falling channel.
The potential of a disruption in oil supply from the Middle East drove WTI to its biggest rally in four weeks.
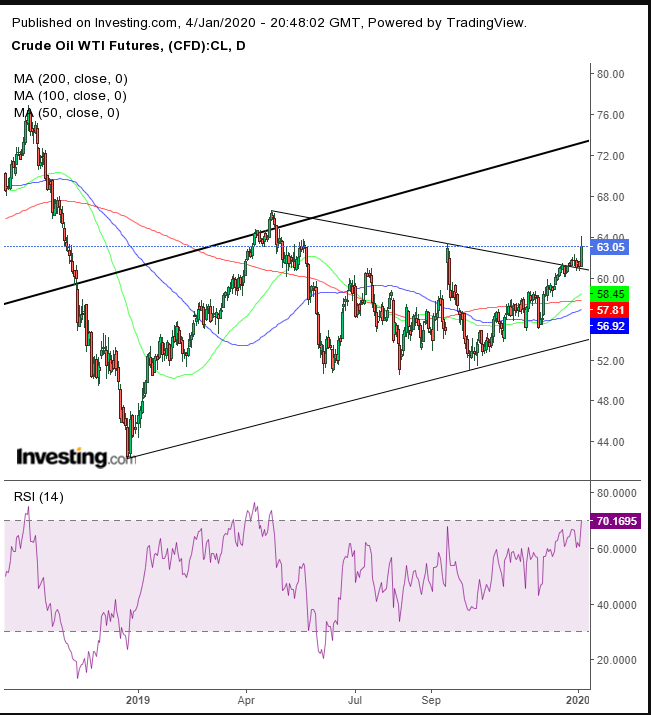
Technically, the jump confirmed the support of the top of a symmetrical triangle since the December 2018 bottom, reaching the highest levels since May 20. We believed, earlier, that the triangle’s risk is to the downside, considering it came after oil fell below its uptrend line since the 2016 bottom.
However, the breakout to the topside, and the 50 DMA crossing over the 200 DMA—triggering a golden cross—increase the probability for another attempt at the uptrend line since the 2016 lows. Investors should, however, wait for the RSI to recede from its 70 level, the most overbought condition since Apr. 23, right before oil fell 23.6% in the 6 weeks till June 5.
Week Ahead
All times listed are EST
Monday
4:30: UK – Services PMI: expected to edge up to 49.1 from 49.0, still in contraction territory.
Tuesday
5:00: Eurozone – CPI: seen to rise to 1.3% from 1.0%.
10:00: U.S. – ISM Non-Manufacturing PMI: probably rose to 54.5 from 53.9.
Wednesday
8:15: U.S. – ADP Nonfarm Employment Change: forecast to leap to 156K from 67K previously.
10:30: U.S. – Crude Oil Inventories: drawdown anticipated to be -3.288M from -11.463M.
Thursday
2:00: Germany – Trade Balance: expected to slip slightly to 19.7B in November from 20.6B in October.
19:30: Australia – Retail Sales: seen to have grown to 0.2% from 0.0%.
Friday
8:30: U.S. – Nonfarm Payrolls: expected to plunge to 160K from 266K.
