- Investors are back to cheering for a bad economy, as it enables additional stimulus
- Gold gains on dollar weakness, safe haven
The S&P 500 and Dow Jones Industrial Average hit new all-time highs on Friday, while the NASDAQ and Russell 2000 both pushed higher after the April Nonfarm Payrolls release printed considerably below expectations, allaying inflation concerns and signaling that Fed easing will likely remain in play. As such, we expect stocks to continue moving higher, as traders cheer ongoing stimulus.
However, we also anticipate considerable whipsawing in the medium-term, as potentially conflicting data will remain a factor, causing experts to continue arguing about the possibility of rapidly rising inflation and the economy overheating.
The dollar plunged and gold moved higher, penetrating more deeply into the $1800 level.
Bad Economy, Positive For Investors?
Ten of the S&P 500's 11 sectors finished in green territory, while Consumer Staples ended flat. Energy, (+1.8%), Real Estate, (+1.2%) and Industrials, (+1.1%), outperformed.
Energy, in fact, opened -1.2% lower in early trading, while the Tech sector opened 0.8% higher, after the much-lower-than-expected employment numbers shocked markets. The payrolls increase of 266,000 was significantly below the 1 million new jobs forecast. President Joseph Biden's reacted to the release by saying of a full US economic recovery, "the climb is steep and we still have a long way to go."
After the report, investors quickly shifted funds into areas that provided superior performance during the pandemic while dumping shares that outperform during an economic recovery, including energy stocks. However, after falling sharply at the open, Energy went on to have a stellar day, finishing up almost twice as much as the next-best performer. Technology stocks, on the other hand proceeded to trim gains as the day wore on, or even slump into the red.
The market narrative is that the disappointing employment data supports the view that inflation is transient and therefore not expected to impede the recovery. It also boosts the notion that a slow economic recovery will merit continued fiscal and monetary support from government agencies. With that in mind, investors backtracked and returned to the Reflation Trade.
As we've pointed out repeatedly, in an alternate, QE-driven environment (such as the one we're currently experiencing), a bad economy is viewed as positive for investors, since they'll continue to enjoy a market with easy pickings as stimulus keeps stocks bouyant, while positive data, which sounds the alarm for tightening, is met with disdain.
By advancing on Friday, the S&P 500 may have reversed a bearish pattern.
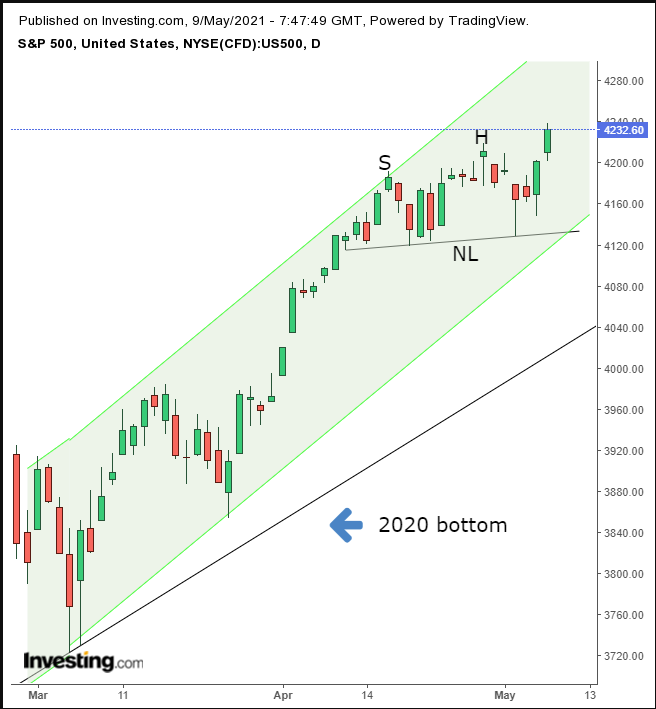
The gains took the index above what would have been a small H&S top, rebounding off the short-term rising channel, keeping a higher rate of ascent than the long-term uptrend line since the 2020 bottom.
With consumer spending a whopping 70% of US GDP, jobs are a crucial cog of the American economic machine. That’s why the monthly NFP data release has such a strong impact on the market. However, such reactions tend to be short-term.
More significantly, inflation concerns remain a central theme driving markets. But since it's an ongoing, fluid statistic, it requires a number of reads to demonstrate a trend. Considering that Initial Jobless Claims, which are forward looking, fell this past week to the lowest level since the onset of the coronavirus pandemic, no downtrend for jobs creation has been established.
Since the end of March, investors continue going back-and-forth on their outlook for inflation. This manifests precisely on the chart for Treasury yields, including for the 10-year benchmark.
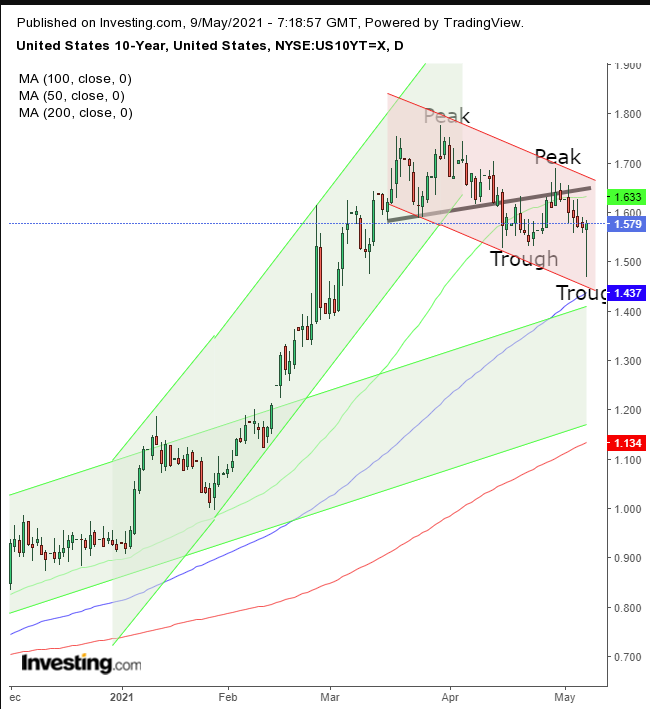
Rates topped out on Mar. 30, completing a double top. This reasserted its resistance upon a return move. Friday’s trading developed a powerful bullish hammer, but it’s at the bottom of the current falling channel, as it meets with an earlier rising channel.
This standoff between support and resistance in yields aptly reflects the internal conflict of the market concerning the outlook for inflation and interest rates.
The shift in outlook pushed the dollar below its Apr. 29 low, as it closed beneath its uptrend line from the Jan. 6 bottom.
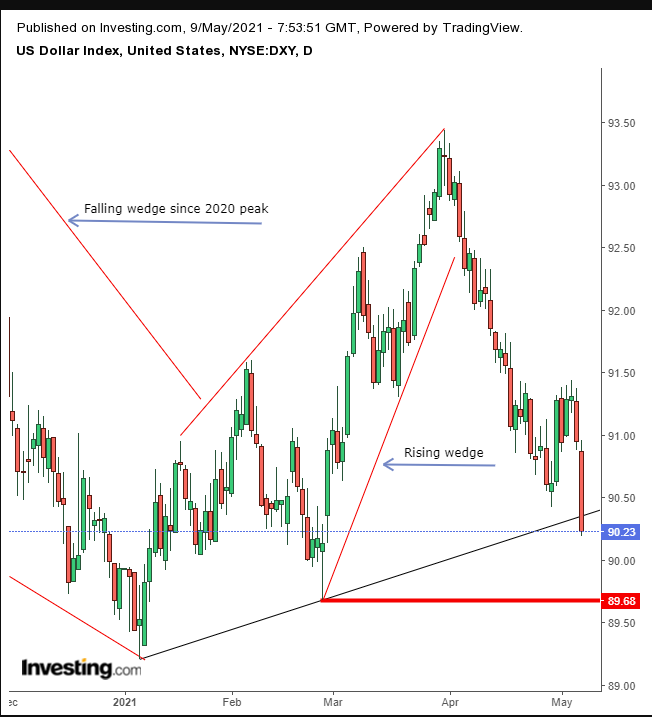
Selling was represented by the smaller rising wedge; it's going up against the much larger falling wedge since the 2020 peak. The unanswerable question right now, of course, is which will ultimately win?
Gold climbed, as rate hikes seemed further away, and the USD weakness made the dollar-denominated yellow metal cheaper.
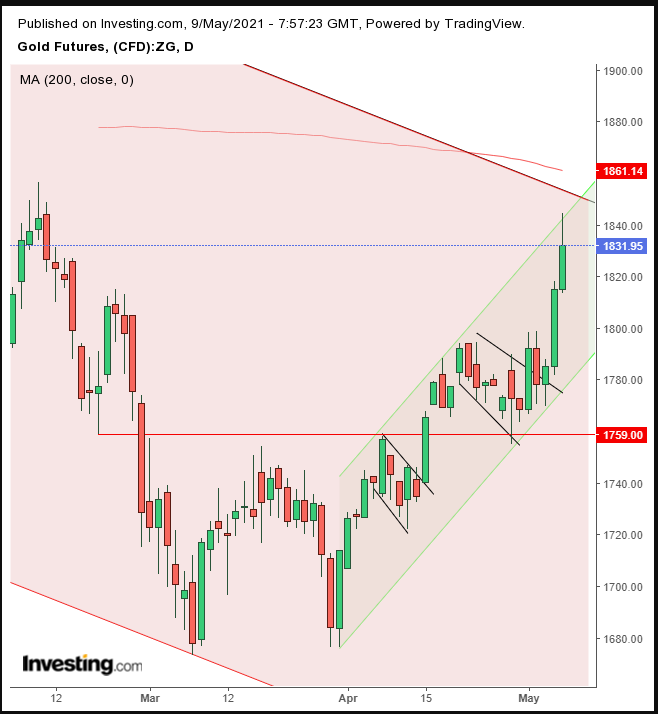
However, the precious metal found resistance at the top of its falling channel since the March peak, joined by the 200 DMA. Having realized the double bottom and two subsequent bullish flags over the short-term, the expectation is for a continued downtrend. This view is the mirror image of the dollar retesting its bottom.
Bitcoin rose Friday and Saturday, even as another politician called for government intervention into the digital currency and its peers. On Sunday the largest cryptocurrency by market cap reversed and is falling at time of writing.
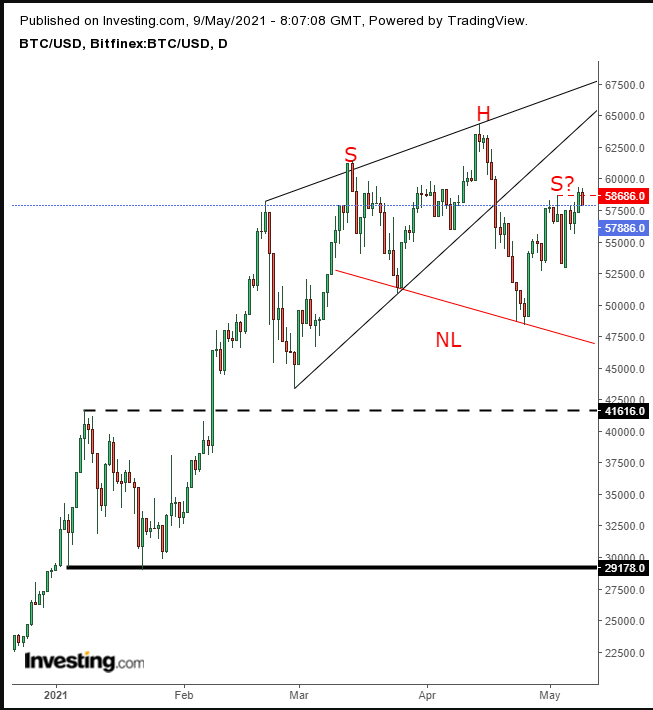
Last week we provided a bearish call on Bitcoin, saying it could halve in value, perhaps as quickly as in three months. The current decline confirms the resistance to Monday’s shooting star.
Oil is expected to resume its rising channel after a cyberattack, reported on Friday by privately held Colonial Pipeline, halted operations on “a major pipeline system that transports 45% of fuel across the East Coast."
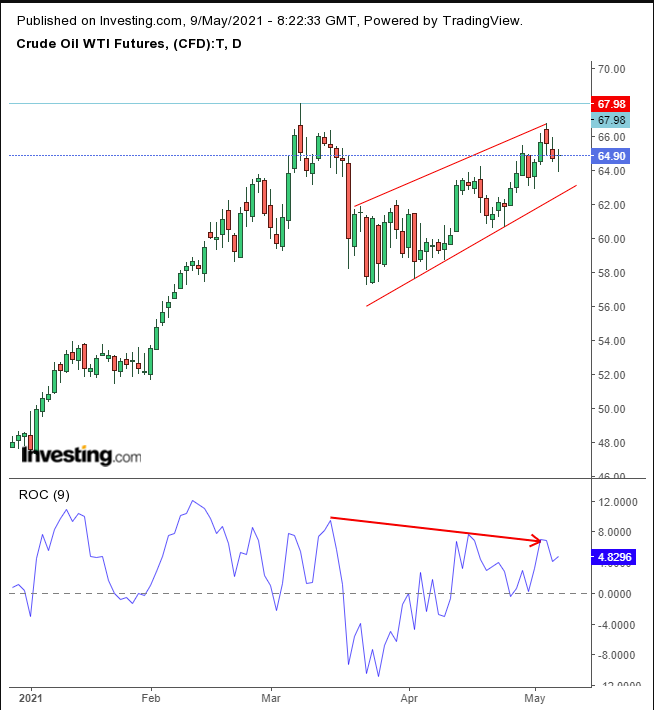
The immediate crisis could become the trigger to help prices finally breach the Mar. 8, $67.98 high, the highest level for WTI since October 2018. Till now, momentum has been weakening, providing a negative divergence.
Week Ahead
All times listed are EDT
Sunday
21:30: Australia – Retail Sales: seen to remain flat at 1.4%.
Monday
21:30: China – CPI: to rise to -0.2% MoM from -0.5% previously.
Tuesday
5:00: Germany – ZEW Economic Sentiment: expected to edge higher to 71.0 from 70.7.
8:00: US – EIA Short-Term Energy Outlook
10:00: US – JOLTs Job Openings: predicted to rise to 7.500M from 7.367M.
Wednesday
2:00: UK – GDP: forecast to drop to -1.7% from 1.3% QoQ, but to climb on a YoY basis to -6.0% from -7.3%.
5:00: UK – BoE Gov Bailey Speaks
8:30: US – Core CPI: anticipated to hold steady at 0.3%.
10:30: US – Crude Oil Inventories: seen to catapult to -2.346M from -7.990M.
Thursday
8:30: US – Initial Jobless Claims: predicted to edge higher, to 540K from 498K.
8:30: US – PPI: expected to retreat to 0.3% from 1.0%.
Friday
7:30: Eurozone – ECB Monetary Policy Statement
8:30: US – Core Retail Sales: seen to plummet to 0.9% from 8.4%.
8:30: US – Retail Sales: expected to drop to 0.2% from 9.7%.
