The last time I asked a similar question, the answer turned out to be “nothing good for now.”
It was Aug. 19, when the Federal Reserve’s minutes for its July meeting were due to be published. Expectations were high among traders that the central bank’s Federal Open Market Committee would be keen to introduce yield curve controls that would allow it greater leverage to manage inflation.
The traders, of course, couldn’t care less whether the Fed achieved what it wanted, so long as they got what they wanted—and that is perpetually low bond-yields and a never-ending river of stimulus.
The minutes revealed that after considerable thought, the FOMC’s members had balked at the yield curve control plan, saying the costs of the program outweighed its benefits.
Following that, the trading community responded with a vengeance, targeting gold, which had just clawed its way back to $2,000 an ounce after collapsing from record highs of nearly $2,090 two weeks earlier. Spot gold, the tracker for bullion, lost 3.6% that day alone, after the 5% drop a week earlier.
Fast forward to another Fed event a week after the Fed minutes—the virtual Jackson Hole Symposium—and Chairman Jay Powell again left out what gold traders wanted to hear: an unequivocal pledge to continue loading up on assets to backstop the U.S. economic recovery from the coronavirus.
To be fair, the central bank chief had a more important long-term Fed inflation plan to reveal. But traders being traders, needed to hear what was important to them. Again, gold became the whipping boy, although its loss this time was comparatively less, at just 1.3%. Importantly, it also recovered over the next three sessions.
Will It Be Any Different This Time?
Which brings us to the question at hand: What can the Fed do differently for gold when the FOMC opens its two-day meeting today, before announcing its interest rate decision on Wednesday, followed by Powell’s news conference.
Interest rates themselves aren’t expected to be news at this week’s meeting—they haven’t been for many months, with the Fed looking very comfortable with its zero to 0.25% holding rate.
But Powell will most likely revisit the central bank’s mission of higher-for-longer inflation. The key, as usual, will be what he does or doesn't say about the stalling economic recovery, tepid jobs numbers over the past two months (after a strong rebound in May to June), and how keen the Fed is on its continued expansion of its limitless balance sheet.
The formula is almost always the same: the more dovish the Fed Chair, the greater the chance that the dollar index, an alternative trade to gold, will tumble, giving the yellow metal a bid.
In Tuesday’s Asian trading, the index, which pits the greenback against six major currencies, fell as low as 92.83 before clambering nearer to its long-held perch of 93.
Spot Gold’s Break Above $1,969 Holds Promise For Bulls
While the move in and out of the 93-handle is nothing new for the dollar, its latest action had, nonetheless, opened up a long-awaited development on spot gold that bullion traders had been banking on: the move above $1,968.
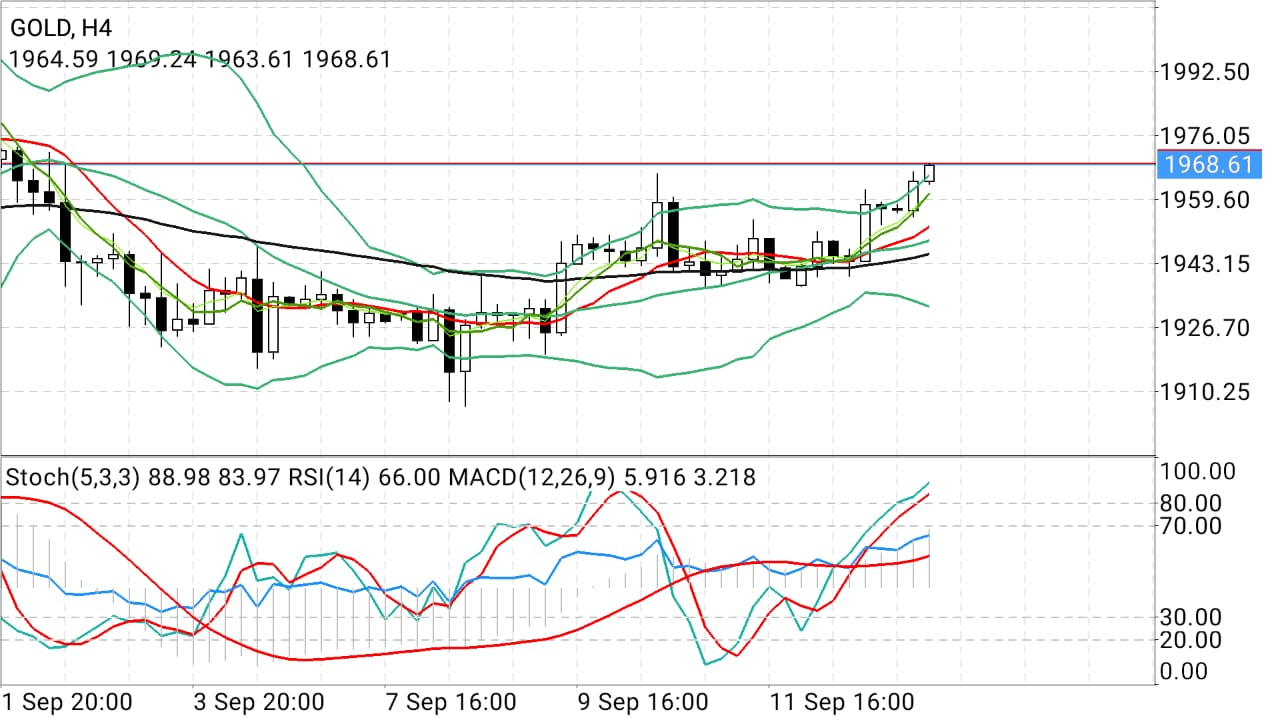
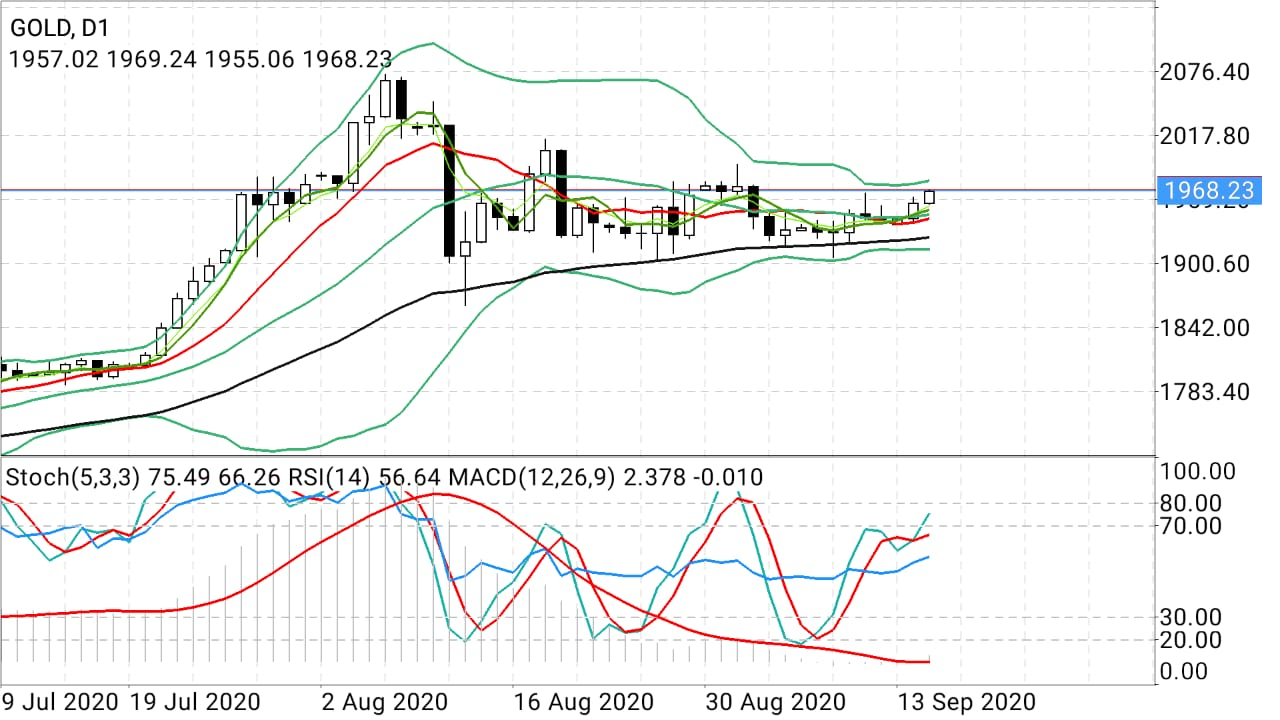
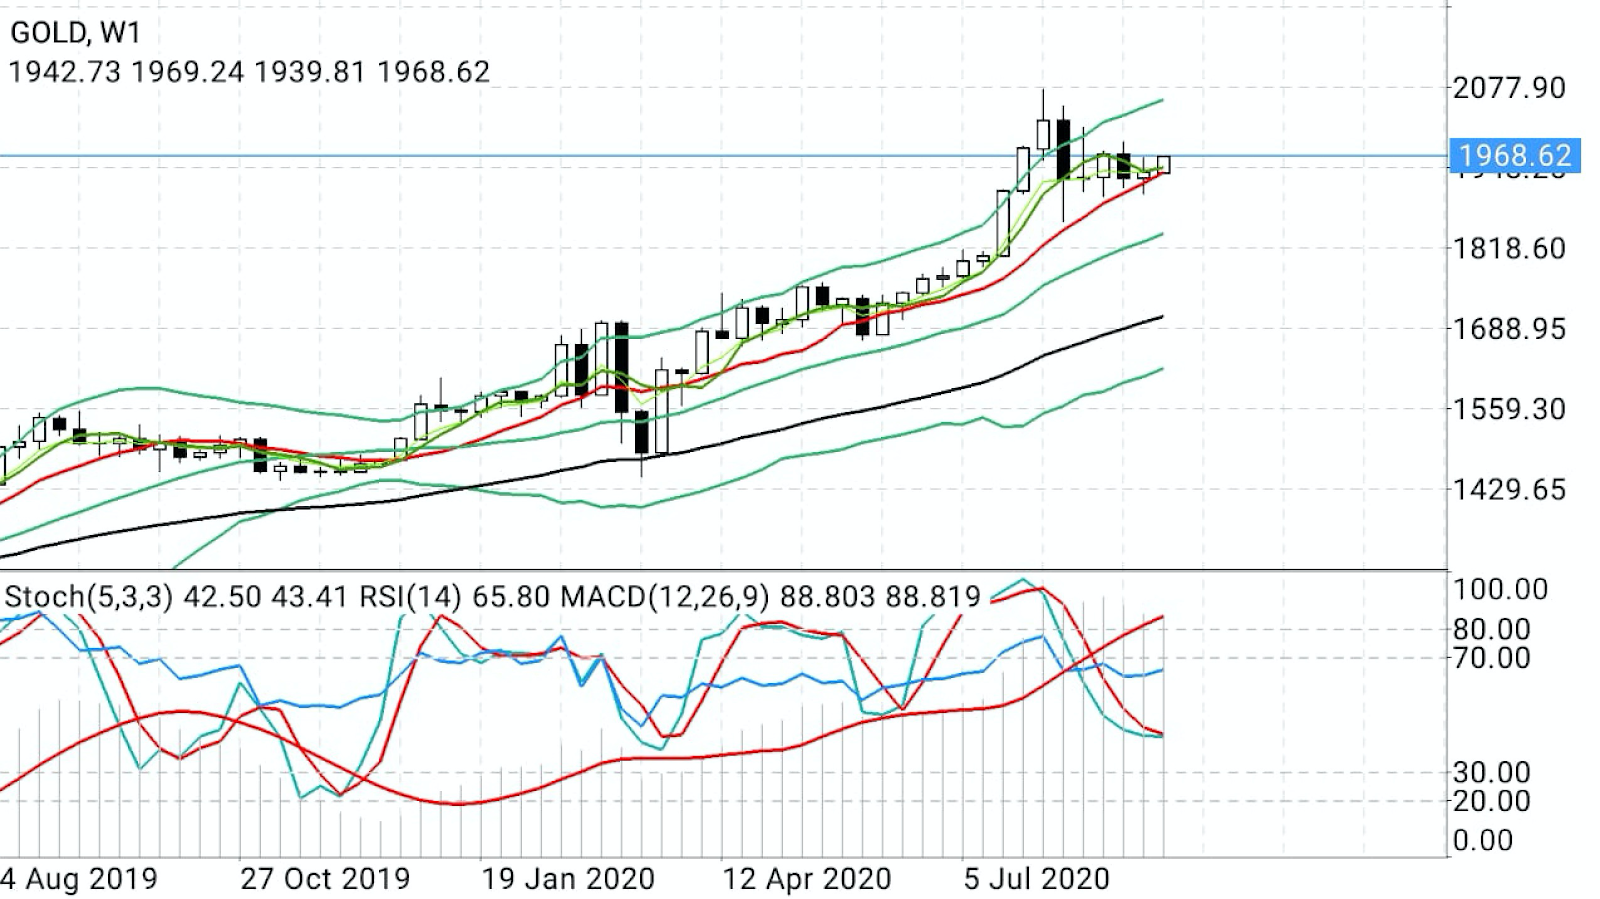
Tuesday’s intraday peak for spot gold was a two-week high of $1,969.34. The $1,968 had been a key price level dodging many technical charts and its opening has likely sent a delicious thrill coursing through gold bulls.

Spot gold 4-hourly chart after Tuesday's break above $1,969

Spot gold daily chart after Tuesday break above $1,969

Spot gold weekly chart after Tuesday's break above $1,969
“To continue its up move, gold should hold above the strategic support of $1,935, for the next upside target and resistance of $1,993,” said Sunil Kumar Dixit, an independent chartist on precious metals. “Sustaining below $1,935 will stop the up move and start correction towards $1,920-$1,900 and $1,888.”
Dhwani Mehta, another technical analyst, noted in a blog posted on FXStreet that there were “plenty of healthy support levels likely to limit any retracements” for gold. Mehta wrote:
“The immediate cushion (is) aligned at $1962, the intersection of the previous day high, SMA200 four-hour and Bollinger Band four-hour Upper. Sellers will then challenge minor support at $1957, where the Fibonacci 23.6% one-day and SMA5 four-hour coincide.”
“Further south, the Fibonacci 23.6% one-week level at $1951 will get tested. A break below which a dense cluster of support levels is seen around $1947. The downside target of $1945 is the level to beat for the bears. That level is the Fibonacci 38.2% one-week.”
Of course, all these levels are also dependent on the outcome of the Fed meeting and Powell’s news conference. Even more importantly, gold will move to the dictum of the dollar. The greenback has shown logic-defying strength through most of August to now, stubbornly holding above the 93-level. It could again dampen the ardor of gold bulls.
Dixit warns as much, saying: “The immediate upside before the Fed meeting will be limited to $1,985. Traders would be cautious to push it beyond that.”
