
After putting in a new quarter-of-a-century low at $1.432 last week, natural gas turned higher to warn over-enthusiastic shorts that the risk of a bearish outlook rises as the price drops. The active month of August futures contract dropped to $1.517 on June 25 and 26. The double bottom formation led to a recovery in the price of the energy commodity. The rally took the price to a high of $1.784 on June 30, a rise of 17.6% from the low.
We are now in the heart of the summer season of the U.S. The demand for air-conditioning is peaking, and the primary ingredient in power generation is natural gas as it replaced coal for electricity production. On Thursday, July 2, the Energy Information Administration released its weekly storage data as of June 26. During the heart of the injection season, the inventories rose and remain well above both last year’s level and the five-year average for this time of the year. The United States Natural Gas Fund (NYSE:UNG) moves higher and lower with the price of NYMEX natural gas futures.
Consensus Estimate Was For 79 bcf Injection
According to Estimize, the crowdsourcing website, the market had expected between a 75-80 billion cubic feet injection into inventories for the week ending on June 26.
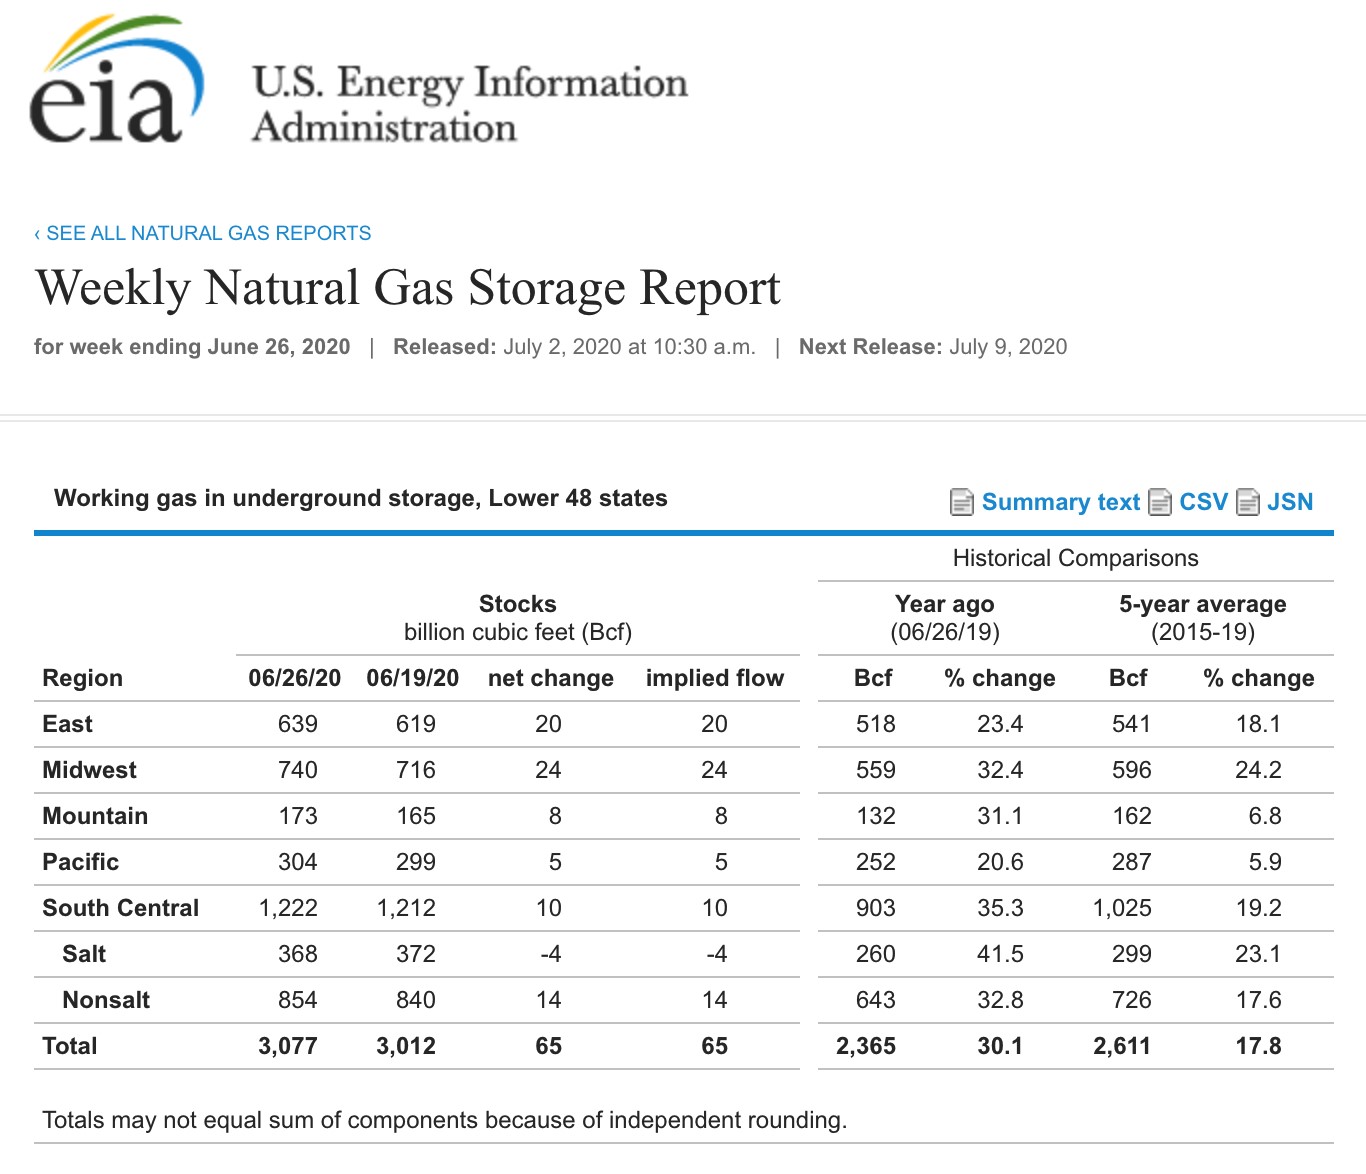
Source: EIA
As the chart highlights, the amount of natural gas in storage rose by only 65 bcf, which was lower than expected. Total stockpiles at 3.077 trillion cubic feet were 30.1% above last year’s level and 17.8% over the five-year average for this time of the year. It was the 14th straight week where the percentage over last year’s level declined. While inventories are substantially higher than last year at this time, the percentage above last year’s level has been steadily shrinking since March, which could be a sign of slowing production. As of the final week of May, the number of natural gas rigs operating in the U.S. stood at 75, compared with 173 at the end of May in 2019.
Natural Gas Bounces
Natural gas futures on NYMEX did not wait until the July 2 EIA report to rally. The price had reached a new low last week and rejected the 25-year low.
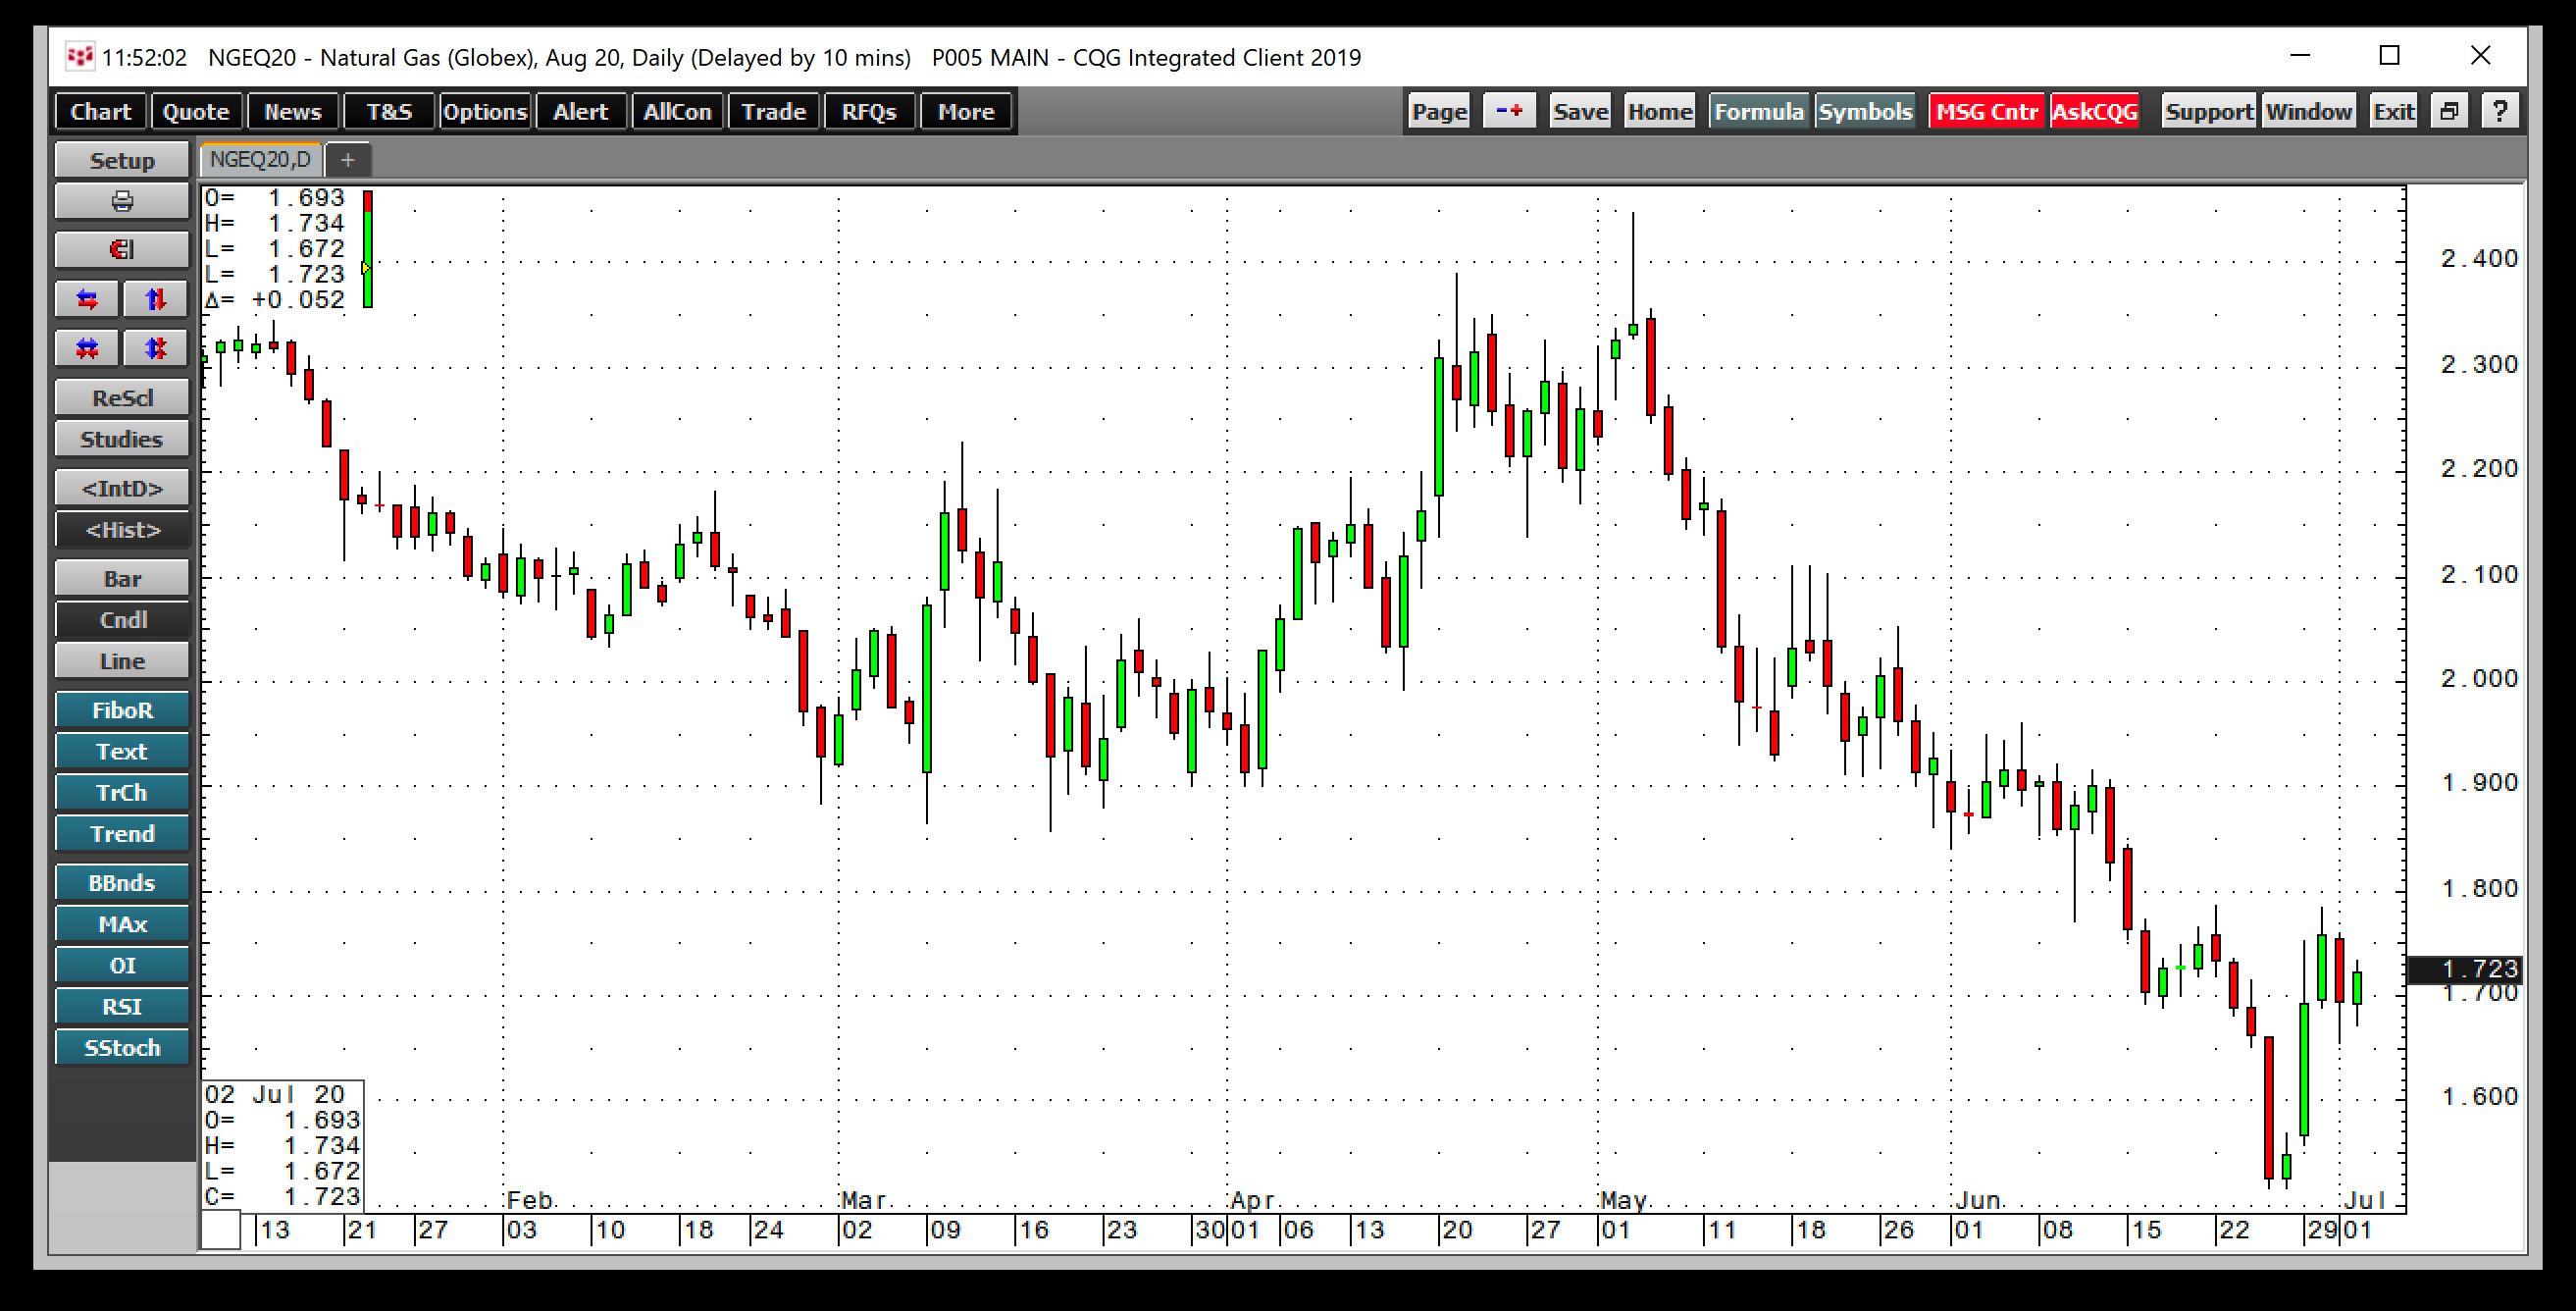
Source: CQG
After the double bottom at $1.517 per MMBtu, the price of natural gas recovered, reaching a high of $1.784 on June 30. Natural gas finished the second quarter of 2020 with a 6.77% gain but was still 20.01% lower over the first six months of 2020. The price bounced 17.6% higher from the most recent low to the June 30 peak.
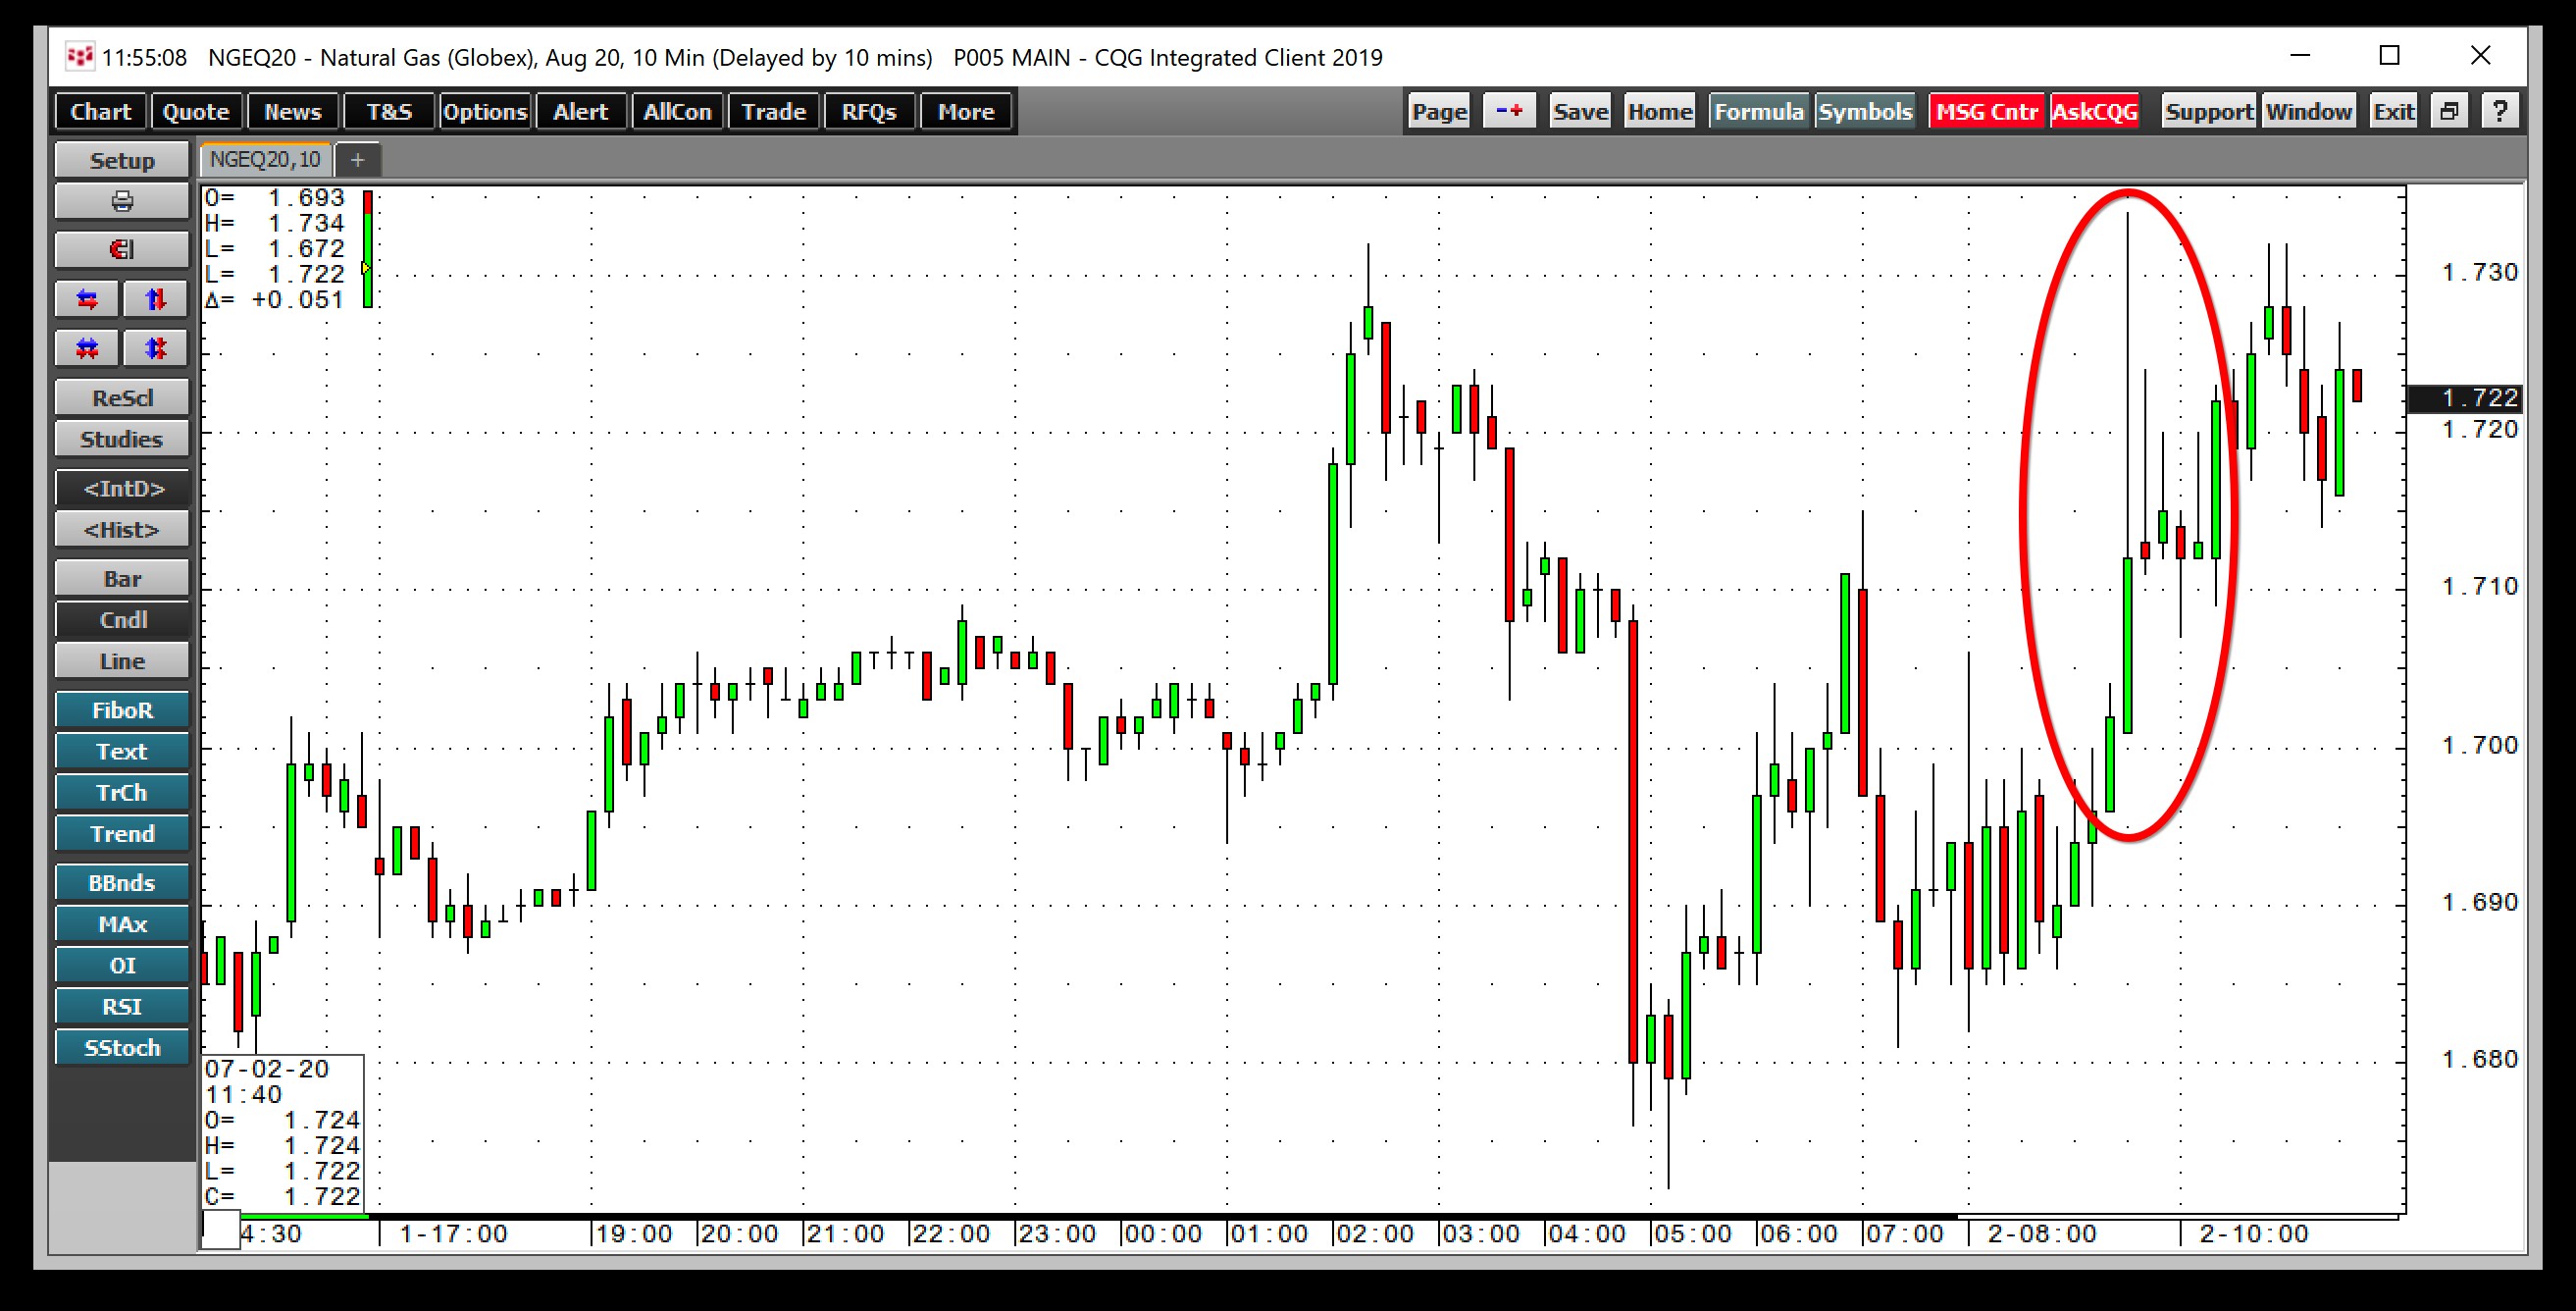
Source: CQG
The 10-minute chart on July 2 shows that the price moved higher after the EIA reported a lower than expected injection into inventories on Thursday. The price was back over the $1.70 per MMBtu level.
Relief Rally Overdue
The price action in the natural gas futures arena encouraged shorts to increase their selling activity after the early May high at $2.162 per MMBtu.
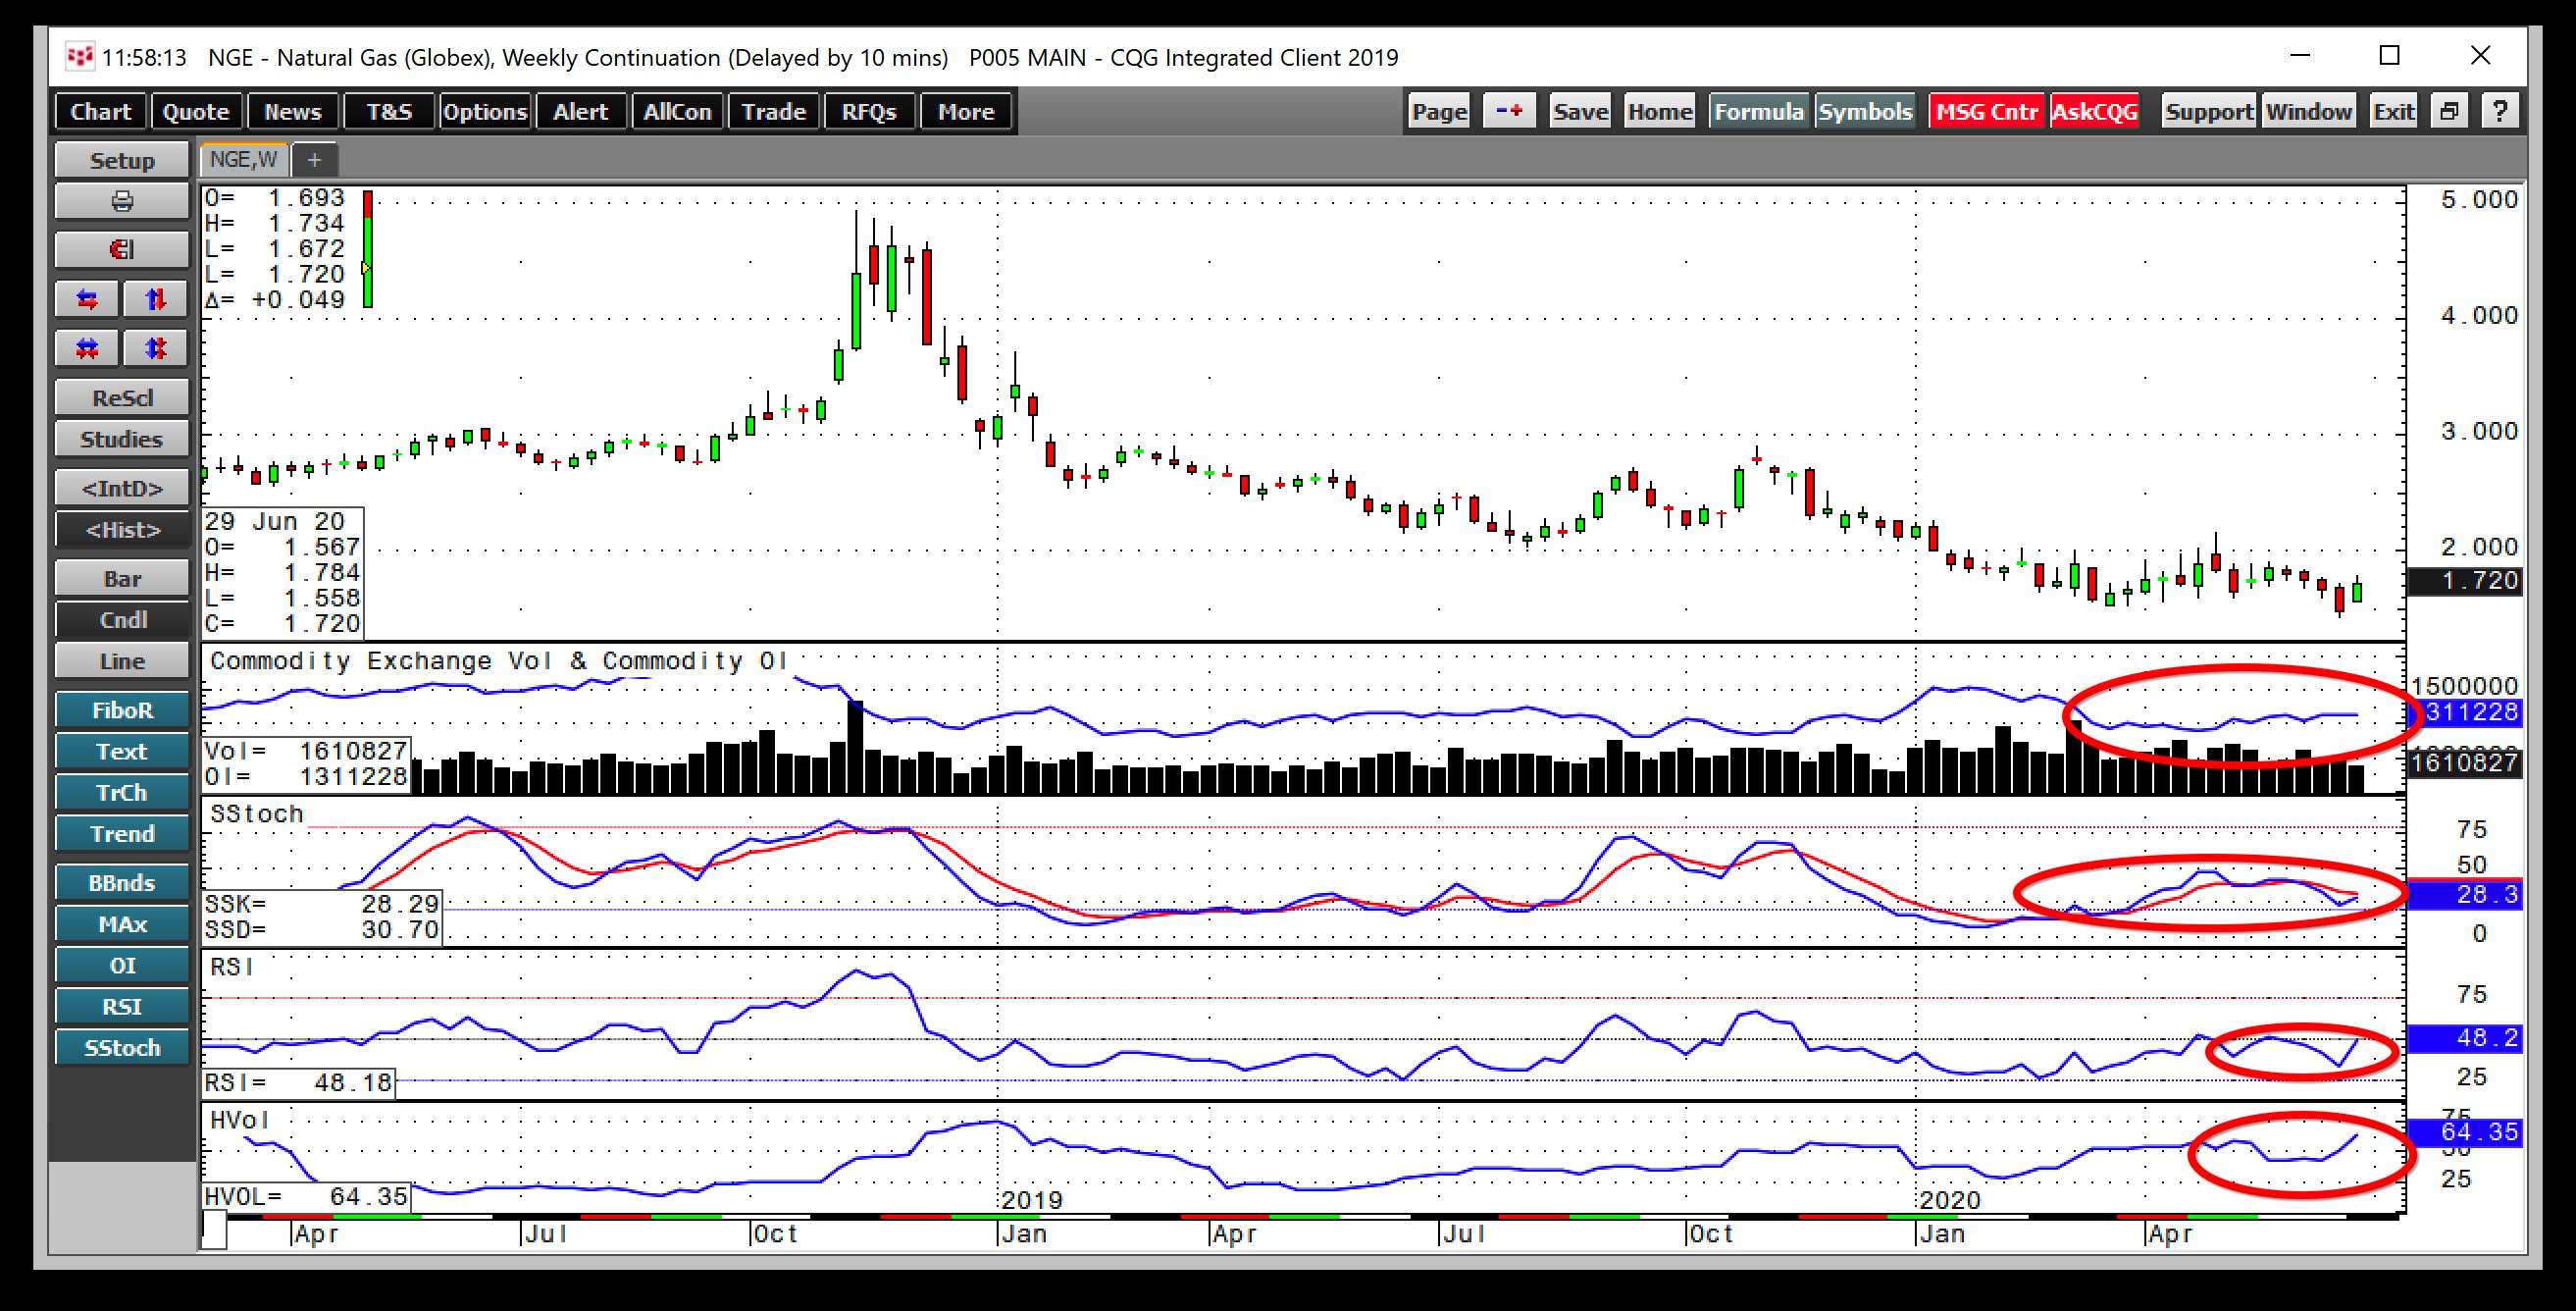
Source: CQG
The weekly chart shows the descent from $2.162 to a low of $1.432 in late June. The total number of open long and short positions rose from below 1.2 million to over 1.311 million contracts as the price fell. The increase in open interest was a sign of an increase in short selling in the natural gas market as speculators pushed the price of the energy commodity to a new quarter-of-a-century low.
Price momentum and relative strength indicators fell to oversold conditions. As selling ran out of steam, the price recovered. The move to the upside sent weekly historical volatility from below 42% to over 64.5% as weekly trading ranges expanded. The recovery in the natural gas futures market was overdue. The latest inventory data was supportive of the price of August futures.
Production May Be Falling, But Inventories High
During the hot summer months, the demand for natural gas will rise as air-conditioners are running overtime. The decline in the number of natural gas rigs, which were 98 lower as of June 26 and the smaller injection into storage at the end of June, are signs that production is declining. Meanwhile, stocks remain 30.1% higher than last year and almost 18% above the five-year average for this time of the year, which will prevent natural gas from running away on the upside. However, a move to $2 or challenging the early May continuous contract high at $2.162 per MMBtu is not out of the question. Above there, the high in August at $2.447 is the next technical level on the upside.
I do not expect a price explosion to the upside in natural gas. A move from the low $1.70s to $2 or higher, which would be a recovery of over 16%, is highly probable. The EIA data on July 2 was bullish for the price of the energy commodity and supports a continuation of the recovery.