
With Phase 1 close to being signed, markets can now obsess over Phase 2.
U.S. President Donald Trump announced via Twitter on Tuesday that U.S. and China will finally sign the elusive Phase 1 trade deal on Jan. 15. Taking place at the White House, high level representatives of China will be present. Moreover, Trump also said he will go to Beijing himself “at a later date,” where talks will begin for Phase 2.
Given how long it has taken to reach Phase 1 (which isn’t yet ‘in the bag’), it’s anyone’s guess as to how long the next phase will take. Yet, with the U.S. elections looming, it remains in Trump’s best interest to get it over the line sooner than later, which inadvertently puts him in a weaker spot in terms of negotiating. While Trump has publicly said he doesn’t need a trade deal before the election, it seems unlikely he won’t want Phase 2 complete. So, we could well see delaying tactics from China in order to squeeze extra concessions for Phase 2.
S&P500 E-mini futures gapped higher on Tuesday and now trade just below their record highs. A small bullish candle on New Year’s Eve respected the 10-day eMA and suggests a swing low could be in at 3213. Yet, if 3213 is to be broken, it points towards a deeper correction and not a trend reversal.
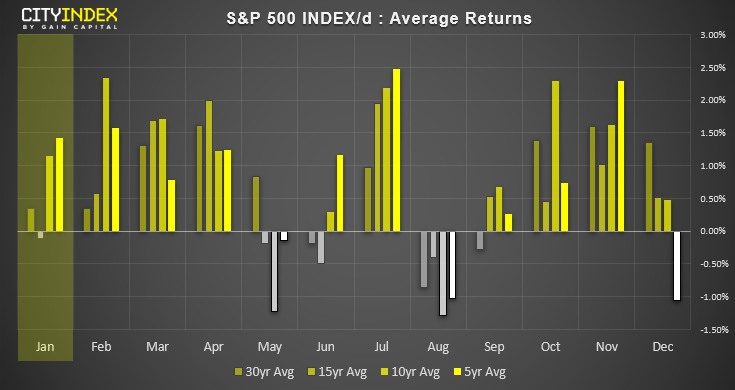
Looking at seasonality for the S&P 500, January tends to fare well as it’s posted average positive returns over the past 30, 10 and 5 years. Median returns are all positive over these look-back periods, and it’s seen bullish closes 60% of the time over the past 30 years.
Time will tell if January will see it break to new high, but the trend structure on S&P 500 is clearly bullish with its series of higher lows and remains above its bullish trendline.
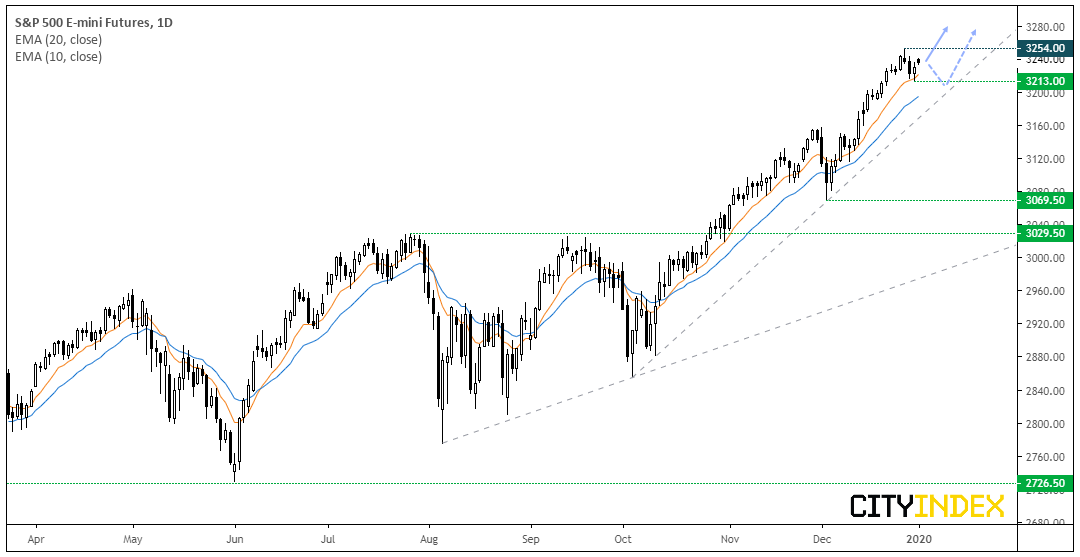
- Near-term bias remains bullish above 3213.
- A break below support suggests a deeper correction is on the cards, and bulls can then refer to the bullish trendline to see if a swing low is carved out.
- A break above 3254 assumes bullish continuation. As this would be a fresh all-time high, we’d use an open upside target.