By Marc Jones
LONDON (Reuters) - What a wild quarter for the markets! The yen's strongest run since the 2008 global crash, central banks swivelling at speed, oil diving, gold shining and China spraying economic stimulus.
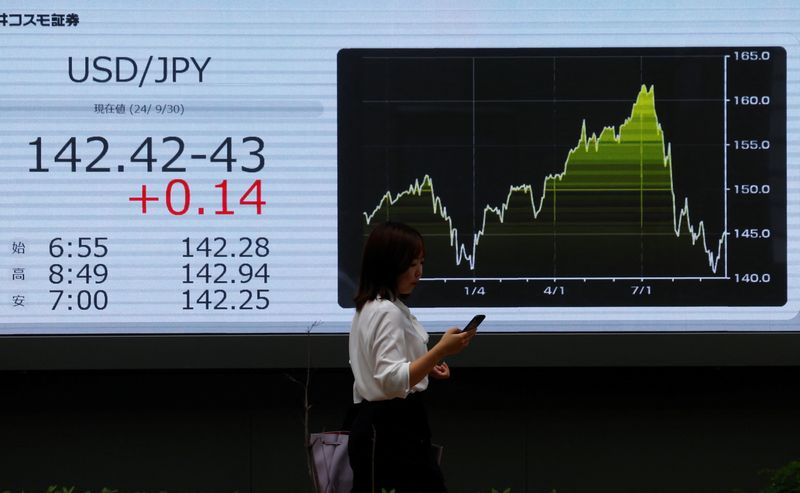
The Q3 scores show world stocks and U.S. Treasuries both up around 6%, gold almost 15% higher, the yen up a whopping 11%. Oil is 17% lower and central banks have just delivered the biggest batch of interest rates cuts since the COVID-19 pandemic.
The storms started when the normally docile yen went wild at the idea of higher Japanese rates at almost exactly the same time U.S. economic data started looking queasy.
In just a few weeks, MSCI's main world equity index shed $6 trillion in one of the fastest sell-offs in years, especially for Big Tech. Traders went from pricing one or two U.S. rate cuts this year to five or six.
"The biggest thing that happened in Q3 was that the yen carry trade broke down," Societe Generale (EPA:SOGN)'s Kit Juckes said, explaining the strategy of borrowing cheaply in Japan to buy higher-yielding assets elsewhere.
"That, along with the first pieces of weak U.S. data, really changed the market."
The prospect of lower borrowing costs did the trick though. By the end of August, world stocks had rebounded and Chinese markets were about to make a remarkable turnaround of their own.
As Beijing turned on the stimulus taps, including lower rates and measures aimed at the ailing property market, Chinese stocks have just notched up their strongest week since 1996 and real estate shares have rocketed by a third.
China's largesse has also helped spur the biggest quarterly spike in both emerging market stocks and the main global volatility gauges since 2022.
"China needs to recover to see a turnaround in the asset class," said Claus Born, an emerging markets equity portfolio manager at Franklin Templeton. "China's influence is very important".
A BIT LESS MAGNIFICENT
Markets are still showing signs of bruising from the August turmoil.
Among the "Magnificent Seven" tech stocks that dominate world markets - Nvidia (NASDAQ:NVDA), Microsoft (NASDAQ:MSFT) Amazon (NASDAQ:AMZN) and Google (NASDAQ:GOOGL) - are all ending the quarter lower than where they were at the start.
Don't panic yet though, Apple (NASDAQ:AAPL), Meta (NASDAQ:META) and Tesla (NASDAQ:TSLA) are up 9%, 13% and 32% respectively in Q3 and Nvidia is up a staggering 145% for the year.
In commodities, the big Q3 shift has been the 17% slide in oil, despite escalating conflict in the Middle East where Israel's bombings have now spread to Lebanon.
The Middle East tensions and the weaker dollar have helped gold to set new record highs and it looks set have had its strongest quarter since 2016.
In agricultural commodities, cocoa shortages have pushed prices up 87% for the year, which will be its second biggest annual price jump on record barring a Q4 meltdown.
Europe has not escaped the volatility. French bond risk has exploded to its highest level since the euro zone crisis after gains by the far right has caused major headaches for French President Emmanuel Macron.
As a result, investors are now demanding a higher interest rate to buy 5-year French debt than they do from Greece, the country that was at the centre of the euro zone crisis.
The euro has also fallen against European peers like Britain's pound and the Swiss franc.
Distressed debt specialist fund Gramercy said the rise in French government bond yields which also includes the Franco-German yield differential topping 80bps had prompted comparisons to the “Liz Truss moment” that the UK gilt market endured two years ago.
TRUMP CARD
But there's no chance of a quiet end to the year, with the fourth quarter set to be dominated by November's U.S. election between Donald Trump and Kamala Harris.
Analysts at BofA highlight that even in normal conditions the CBOE's VIX index, the Wall Street "fear gauge", typically rises around 25% between July and November in U.S. election years.
The vote - which could bring trade tariffs if Trump wins - will trigger even more turbulence if investors sense the outcome might influence the Fed's rate plans.

JPMorgan (NYSE:JPM)'s economists estimated U.S. inflation could jump 2.4% if Donald Trump wins and slaps a 60% tariff on all China imports and a 10% universal minimum tariff on those from elsewhere. They also think it would push the dollar up 4-6%.
Fidelity's Henk-Jan Rikkerink said that the wild card for the markets (for Q4) is a broadly more complex set of geopolitical risks. "The conflicts in the Middle East and Ukraine roll on, with no end in sight, and the US election beckons on November 5th."
(Additional graphic by Pasit Kongkunakornkul; editing by Jane Merriman)