By Ketki Saxena
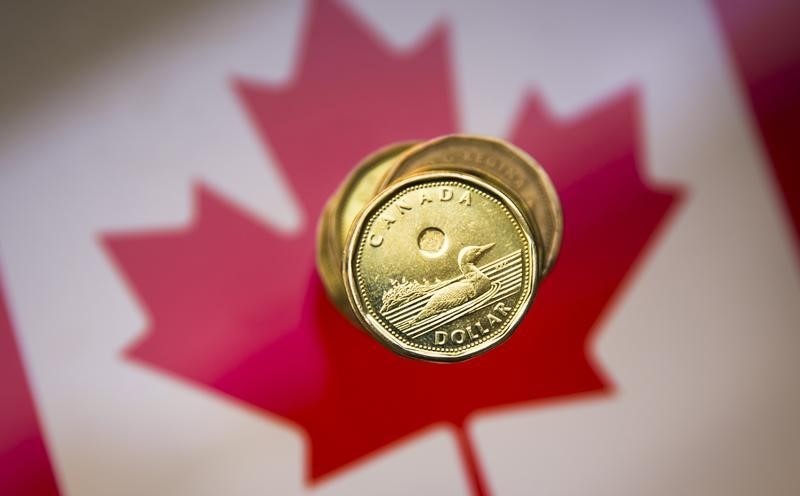
Investing.com -- The Canadian dollar on Friday weakened against its U.S. counterpart following weaker than expected Q2 GDP data, which boosted the odds that the Bank of Canada must conclude its interest rate hikes this policy tightening cycle.
Canada's economy contracted in the second quarter at an annualized rate of 0.2% while growth was most likely flat in July. On a monthly basis, June gross domestic product declined 0.2% from May. The quarterly data was far lower than the Bank of Canada's (BoC's) forecast for a 1.5% annualized GDP growth as well as the 1.2% gain expected by analysts.
"The Bank of Canada's job is done," noted Adam Button, chief currency analyst at ForexLive. "The Canadian dollar is selling off because the debate will quickly shift to when rate cuts are coming. It's not out of the question that we are already in a recession in Canada."
In other signs of the weakening Canadian economy, separate data showed that he S&P Global (NYSE:SPGI) Canada Manufacturing Purchasing Managers' Index (PMI) fell to a seasonally adjusted 48.0 in August from 49.6 in July, its lowest level since June 2020,
Money markets now see a roughly 8% chance of a rate hike at the BoC's next policy next week - down from a 24% chance before the release of the GDP data.
Markets are further fully pricing in rate cuts from the Canadian central bank next year. A rate cut is fully priced in by October next year.
The US dollar meanwhile retraced earlier losses in the day after a mixed non farm payroll report, managing to strengthen against a basket of major currencies.
On a technical level for the pair, analysts at FX Street note, "The USD/CAD first resistance would be the 1.3600 figure. A breach of the latter will expose the August 25 high at 1.3640, closely followed by the May 26 swing high at 1.3654 and the April 28 high at 1.3667. Once those levels are cleared, the 1.3700 figure would be up next before rallying towards the March 24 daily high at 1.3804."
"Conversely, if the USD/CAD drops below 1.3489, the pair could shift downwards and extend its losses toward the 200-day Moving Average (DMA) at 1.3462. Once cleared, the next stop would be the psychological 1.3400 area, and up next, the 50-DMA at 1.3345."
