Breaking News
Investing Pro 0
Final hours: unlock premium data with Claim 60% OFF

Canadian Dollar Manages Weekly Gains On Bets of A Still-Hawkish Bank of Canada

Published Sep 22, 2023 17:51
Saved. See Saved Items.
This article has already been saved in your Saved Items
 
© Reuters.
 
USD/CAD
-0.09%
Add to/Remove from a Portfolio
Add to Watchlist
Add Position

Position added successfully to:

Please name your holdings portfolio
 

By Ketki Saxena

Investing.com -- The Canadian dollar edged lower against the greenback today as risk sentiment remained uncertain after the US Federal Reserve's hawkish hold earlier this week. However, the Canadian currency closed the week at a gain, its second consecutive weekly win.

The Canadian dollar got most of its impetus this week from hotter-than-expected Canadian inflation data, which raised bets of a further rate hike from the Bank of Canada.- a prospect reinforced by the BoC's Summary of Deliberations from its September 6 meeting.

Shaun Osborne, chief currency strategist at Scotiabank (TSX:BNS) notes, "Swaps are reflecting a 93% risk of a 25bps hike in January but another hot inflation report on October 17th would raise the risk of an earlier (and potentially more aggressive) move than that; the BoC’s next policy decision is October 25th."

"Canadian short-term yields have firmed and spreads versus the USD have narrowed over the past week— despite the pop in US rates following this week’s FOMC decision."

The US dollar meanwhile rallied against a basket of currencies this week, as US treasury yields surged following the Federal Reserve's monetary policy announcement on Wednesday. While the Fed held rates steady at their current range, it reiterated its higher-for-longer stance on interest rates.

On a technical level for the pair, Greg Michalowski of Forex Live notes, "The up-and-down week is ending with the price between the 100 and 200-hour MAs. The 100-hour MA is at 1.3463 and the 200-hour MA at 1.3497."

Looking ahead for the pair into next week, Michalowski notes that if "the price breaks higher and above the 200-hour moving average, the highest for the week, near 1.3525 and then the 50% midpoint at 1.3536 would be targeted."

"Conversely, if the 100-hour moving average is broken, traders would look toward the low from today's trading of 1.34214 followed by the 100-day moving average of 1.33985. The low for the week at 1.33778 if broken would open the door further downside momentum."
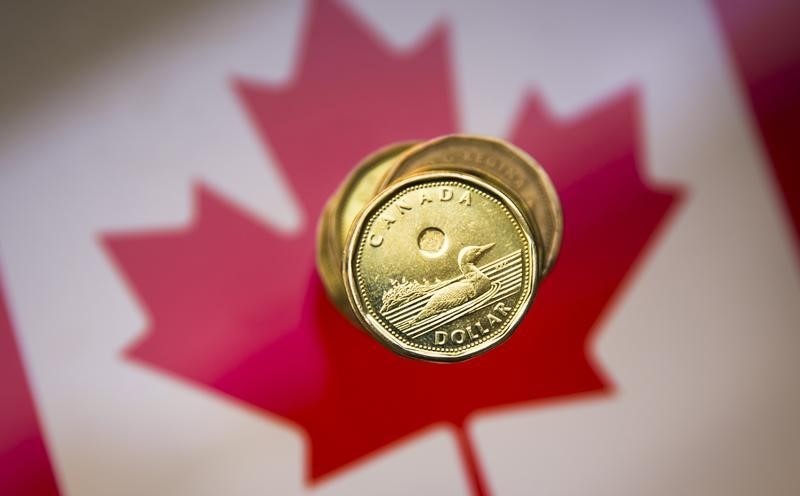
Canadian Dollar Manages Weekly Gains On Bets of A Still-Hawkish Bank of Canada
 

Related Articles

Add a Comment

Comment Guidelines

We encourage you to use comments to engage with users, share your perspective and ask questions of authors and each other. However, in order to maintain the high level of discourse we’ve all come to value and expect, please keep the following criteria in mind: 

  • Enrich the conversation
  • Stay focused and on track. Only post material that’s relevant to the topic being discussed.
  • Be respectful. Even negative opinions can be framed positively and diplomatically.
  •  Use standard writing style. Include punctuation and upper and lower cases.
  • NOTE: Spam and/or promotional messages and links within a comment will be removed
  • Avoid profanity, slander or personal attacks directed at an author or another user.
  • Don’t Monopolize the Conversation. We appreciate passion and conviction, but we also believe strongly in giving everyone a chance to air their thoughts. Therefore, in addition to civil interaction, we expect commenters to offer their opinions succinctly and thoughtfully, but not so repeatedly that others are annoyed or offended. If we receive complaints about individuals who take over a thread or forum, we reserve the right to ban them from the site, without recourse.
  • Only English comments will be allowed.

Perpetrators of spam or abuse will be deleted from the site and prohibited from future registration at Investing.com’s discretion.

Write your thoughts here
 
Are you sure you want to delete this chart?
 
Post
Post also to:
 
Replace the attached chart with a new chart ?
1000
Your ability to comment is currently suspended due to negative user reports. Your status will be reviewed by our moderators.
Please wait a minute before you try to comment again.
Thanks for your comment. Please note that all comments are pending until approved by our moderators. It may therefore take some time before it appears on our website.
 
Are you sure you want to delete this chart?
 
Post
 
Replace the attached chart with a new chart ?
1000
Your ability to comment is currently suspended due to negative user reports. Your status will be reviewed by our moderators.
Please wait a minute before you try to comment again.
Add Chart to Comment
Confirm Block

Are you sure you want to block %USER_NAME%?

By doing so, you and %USER_NAME% will not be able to see any of each other's Investing.com's posts.

%USER_NAME% was successfully added to your Block List

Since you’ve just unblocked this person, you must wait 48 hours before renewing the block.

Report this comment

I feel that this comment is:

Comment flagged

Thank You!

Your report has been sent to our moderators for review
Continue with Google
or
Sign up with Email