Breaking News
Investing Pro 0
💎 Access the Market Tools Trusted by Thousands of Investors Get Started

Loonie Rallies to One Month High Ahead of Domestic CPI, Fed Decision

Published Sep 18, 2023 17:42
Saved. See Saved Items.
This article has already been saved in your Saved Items
 
© Reuters.
 
USD/CAD
0.00%
Add to/Remove from a Portfolio
Add to Watchlist
Add Position

Position added successfully to:

Please name your holdings portfolio
 

By Ketki Saxena

Investing.com - The Canadian dollar rallied to a one-month high against its U.S. counterpart, today, boosted by upbeat investor sentiment ahead of an expected rate hold by the U.S. Federal Reserve this week.

"The Canadian dollar is reflecting global growth optimism at the moment," said Adam Button, chief currency analyst at ForexLive. "China last week stepped up with more stimulus, and American economic data continues to impress."

The loonie's gains also come ahead of domestic inflation data, which will provide further insight on the Bank of Canada's rate path ahead.

Canadian inflation is expected to rise to 3.8% from 3.3% on a monthly basis, driven by rising energy prices, and providing more evidence that boosts the case for the Bank of Canada to hike interest rates. 

"Canadians would love the central bank to declare that rate hikes are over. That's not coming any time soon given the stickiness of inflation and the rise in energy prices," Button noted. 

The case for further rate hikes from the Canadian central bank boosts Canadian bond yields, thus supporting the loonie. 

The Canadian dollar was also supported by a gain in crude prices on worries of tight supply this year on OPEC+ output cuts and weak US shale production. 

Looking ahead for the loonie on a fundamental level, analysts at Scotiabank (TSX:BNS) note, "CAD gains – so far – are limited and there is enough event risk ahead to keep markets cautious on the prospects for the CAD recovery to extend. But it remains somewhat undervalued and perhaps oversold on the charts."

On a technical level for the pair, analysts at FX Street note "The Dollar-Loonie pairing is trading to the midpoint of familiar territory initially reached in late 2022, and the pair is rapidly approaching the 200-day Simple Moving Average (SMA) near 1.3464 as prices slip past the 34-day Exponential Moving Average (EMA), currently turning bearish into 1.3505.

The Relative Strength Index (RSI) and Moving Average Convergence-Divergence (MACD) indicators are firmly bearish on daily candlesticks, and the indicators are warning buyers that there could still be plenty of room to run towards the downside before a successful bullish offensive can be mounted."
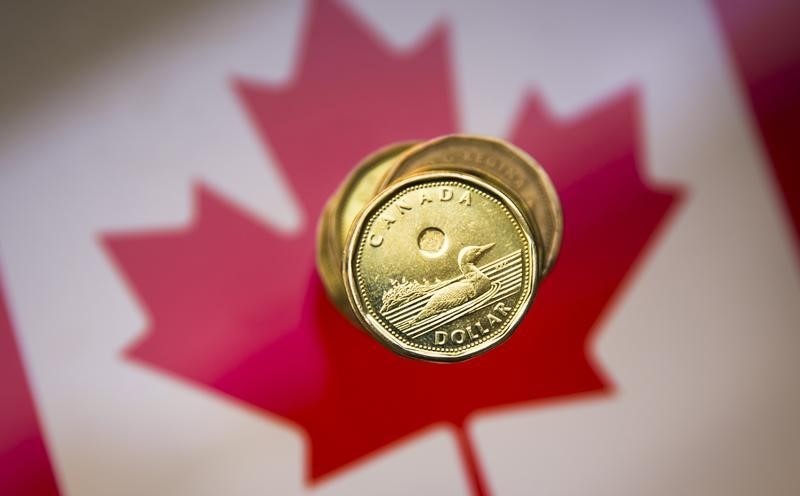
Loonie Rallies to One Month High Ahead of Domestic CPI, Fed Decision
 

Related Articles

Add a Comment

Comment Guidelines

We encourage you to use comments to engage with users, share your perspective and ask questions of authors and each other. However, in order to maintain the high level of discourse we’ve all come to value and expect, please keep the following criteria in mind: 

  • Enrich the conversation
  • Stay focused and on track. Only post material that’s relevant to the topic being discussed.
  • Be respectful. Even negative opinions can be framed positively and diplomatically.
  •  Use standard writing style. Include punctuation and upper and lower cases.
  • NOTE: Spam and/or promotional messages and links within a comment will be removed
  • Avoid profanity, slander or personal attacks directed at an author or another user.
  • Don’t Monopolize the Conversation. We appreciate passion and conviction, but we also believe strongly in giving everyone a chance to air their thoughts. Therefore, in addition to civil interaction, we expect commenters to offer their opinions succinctly and thoughtfully, but not so repeatedly that others are annoyed or offended. If we receive complaints about individuals who take over a thread or forum, we reserve the right to ban them from the site, without recourse.
  • Only English comments will be allowed.

Perpetrators of spam or abuse will be deleted from the site and prohibited from future registration at Investing.com’s discretion.

Write your thoughts here
 
Are you sure you want to delete this chart?
 
Post
Post also to:
 
Replace the attached chart with a new chart ?
1000
Your ability to comment is currently suspended due to negative user reports. Your status will be reviewed by our moderators.
Please wait a minute before you try to comment again.
Thanks for your comment. Please note that all comments are pending until approved by our moderators. It may therefore take some time before it appears on our website.
 
Are you sure you want to delete this chart?
 
Post
 
Replace the attached chart with a new chart ?
1000
Your ability to comment is currently suspended due to negative user reports. Your status will be reviewed by our moderators.
Please wait a minute before you try to comment again.
Add Chart to Comment
Confirm Block

Are you sure you want to block %USER_NAME%?

By doing so, you and %USER_NAME% will not be able to see any of each other's Investing.com's posts.

%USER_NAME% was successfully added to your Block List

Since you’ve just unblocked this person, you must wait 48 hours before renewing the block.

Report this comment

I feel that this comment is:

Comment flagged

Thank You!

Your report has been sent to our moderators for review
Continue with Google
or
Sign up with Email