(Bloomberg) -- The plot twists in markets have lately been riveting. The urge to react has been intense. Doing so has mostly been a mistake.
It’s still early, and things can get fluid when financial stress is afoot. But amid warnings of a banking crisis, a credit-fomented recession, pivoting central banks and stagflation, the best strategy so far — particularly in stocks — has been to sit still.
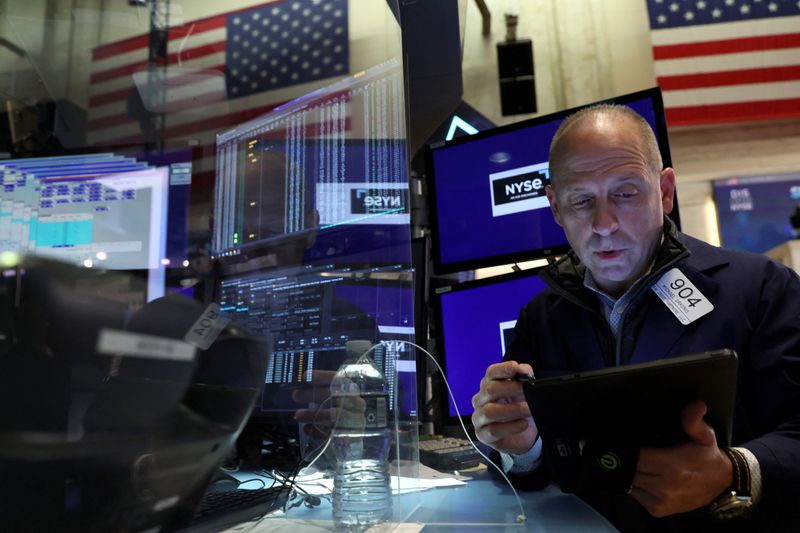
The S&P 500 just capped its second straight up week, and while Treasuries have dealt body blows to short sellers, holding on through the worst volatility in four decades would’ve reaped sizable profits.
Closing your ears to cacophony is standard investment advice that is often borne out. “Panicking never pays,” says April LaRusse, head of investment specialists at Insight Investments. “The smartest thing to do when you have a lot of uncertainty is to sit back and gather information and do your analysis and not jump trying to make big changes.”
Heeding it now requires near-heroic composure. In a span of weeks, the dominant market theme has shifted from a “no landing” scenario where growth persists at the same time central banks push restrictive policy for longer, to everything from banking chaos to a recession to some type of Fed-fueled renaissance in technology shares.
“There are decades where nothing happens; and there are weeks where decades happen,” Marko Kolanovic, chief global markets strategist at JPMorgan Chase & Co. (NYSE:JPM), wrote in a note.
For now, bulls are enjoying the equity resilience, emboldened by hopes that the Federal Reserve will soon pause its aggressive inflation-fighting campaign and regulators including Treasury Secretary Janet Yellen can contain any financial fallout. The S&P 500 added 1.4% over five days, almost erasing its entire loss from the day before the plunge in regional banks two weeks ago. The Nasdaq 100 climbed for a third week in four, sitting about 5% above its pre-crisis level.
Bears are quick to note: the same thing happened in 2008, when the Lehman Brothers collapse incited extreme turbulence, but stock benchmarks still managed to end the ensuing week virtually flat. At present, stocks remain closer to their lows than their highs of last year, when a 25% plunge in the S&P 500 sent a clear recessionary signal — a lot of pain is priced in. But that was true when the worst leg of the last crisis kicked in as well.
To be sure, no one, including policymakers at the Fed, has a firm view on the impact from the banking turmoil. While almost everyone including Fed Chair Jerome Powell expects the crisis to contribute to a tightening of financial conditions, consensus is scant on the exact scope of damage. Among numerous attempts to quantity the impact of lending turmoil on monetary policy, estimates range from 50 basis points to 150 basis points in the equivalent of rate hikes.
It’s the same when trying to gauge the effect on standard economic indicators. At Citigroup Inc (NYSE:C)., strategists suggest the banking crisis is already curbing consumer demand, citing the firm’s data on credit card spending. By contrast, card users at JPMorgan and Bank of America Corp (NYSE:BAC). have stayed buoyant, separate reports from their economists show.
“The Fed has raised the temperature, the water is starting to boil, and we’re starting to see some frogs start to die,” said George Cipolloni, portfolio manager at Penn Mutual Asset Management. “As long as the Fed keeps that temperature at a certain level, there is the potential for more bank failures in this cycle. And that’s one of the reasons why Yellen and some other people are responding the way they are in terms of guaranteeing deposits.”
While split opinions are a constant feature in investing, the extent of the divergence has rarely been this broad. In the equity market, the gap between the highest and lowest year-end target for the S&P 500 is 47%, the widest at this time of year in two decades, data compiled by Bloomberg show.
Conflict is also on display in fixed income. Even as Powell insisted Wednesday that rate cuts are not his “base case,” bond traders stuck to bets that the central bank will reverse course this year. Swap rates linked to policy meeting dates now show cuts totaling about one percentage point by year-end.
Ever-changing views of the economy and Fed have underpinned an almost unprecedented stretch of turbulence in government bonds. For an 11th session through Thursday, two-year Treasury yields moved more than 10 basis points, a run of wild swings not seen since 1981. Among these sessions, seven were up and four down, exerting pain for bulls and bears alike.
Amid all the confusion and volatility, the Nasdaq 100 has stood out as one of the best-performing assets this year, thanks to the dominance of cash-rich tech megacaps. While the index is up almost 17%, getting there has been stomach-churning. Bad timing can be punishing: missing the best five days would have left investors with a gain of only 1%.
To Que Nguyen, chief investment officer of equity strategies at Research Affiliates, investors had better prepare for a bumpy road ahead.
“Most of the time when you have a debt or liquidity problem, it doesn’t go away in two weeks,” she said. “The markets are stable when things are over. So, the fact that we’re still in this massive amount of volatility tells me that things aren’t really over.”