By Thyagaraju Adinarayan and Ritvik Carvalho
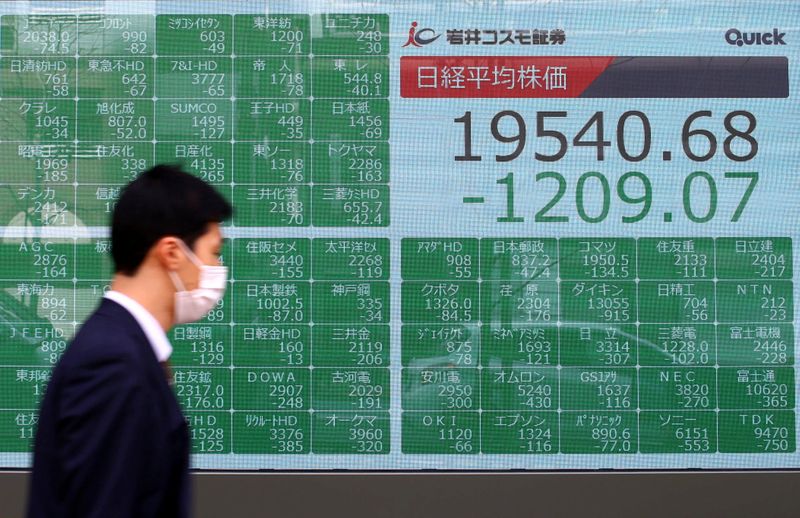
LONDON (Reuters) - A massive oil price collapse overnight and the fast-spreading coronavirus has led to wild price swings across global financial markets on Monday, with some moves as great as 25%.
Those moves came as Saudi Arabia launched a price war with Russia, sending investors already panicked by the coronavirus fleeing for safety.
When was the last time oil giants such as BP (L:BP) and Shell (L:RDSa) shed one-fourth of their value? Never.
The list below highlights some of the biggest price moves and their significance:
** Brent crude (LCOc1) fell as much as 31.4%, the biggest daily drop since the first Gulf War
(Graphic: Brent crude suffers biggest daily drop since first Gulf War - https://fingfx.thomsonreuters.com/gfx/mkt/13/3057/3022/oil.png)
** The yield on 10-year U.S. Treasuries (US10YT=RR) fell further to a record low of 0.4624%, having halved in just three sessions
(Graphic: 10-year UST yield hits record low - https://fingfx.thomsonreuters.com/gfx/mkt/13/3055/3020/ust.png)
** The slump in yield signals another round of big rate cuts by global central banks
** The 10-year Bund yield fell to a record low of -0.863% (DE10YT=RR)
(Graphic: 10-year German bund yield hits record low - https://fingfx.thomsonreuters.com/gfx/mkt/13/3052/3017/bund.png)
** U.S. stock futures plunged 5% to hit their daily down limit and halt trading
** London's FTSE 100 (FTSE) shed 8.4% a few minutes after the open in its worst single-day drop since the financial crisis
(Graphic: British stocks suffer worst one day fall since financial crisis - https://fingfx.thomsonreuters.com/gfx/mkt/13/3054/3019/ftse.png)
** London-listed Shell plunged 23% and BP 29% in their worst-ever intraday rout
(Graphic: BP, Shell suffer worst intraday rout - https://fingfx.thomsonreuters.com/gfx/mkt/13/3051/3016/BP,%20Shell.png)
** The Russian rouble is down over 8%, on track for its worst drop since December 2014, also when oil prices plunged
(Graphic: Rouble on track for biggest daily drop since December 2014 - https://fingfx.thomsonreuters.com/gfx/mkt/13/3056/3021/rouble.png)
** The dollar extended its slide in Asia to as low as 102.60 yen
(Graphic: Dollar/yen falls to lowest since late 2016 - https://fingfx.thomsonreuters.com/gfx/mkt/13/3053/3018/dollar%20yen.png)
** Emerging-market stocks (MSCIEF) dropped over 4% and the world's biggest listed entity, Saudi Aramco (SE:2222), traded below its IPO price for the first time

(Graphic: EM stocks drop 4% - https://fingfx.thomsonreuters.com/gfx/mkt/13/3058/3023/emstocks.png)