While the northern hemisphere prepares to welcome fall, cold weather combined with the global impact of coronavirus means that there will be more people staying indoors in the coming months. In turn, we can expect increased cooking and eating at home. Because eating and drinking are such integral parts of our lives and economies, they can make attractive long-term investments.
According to a report by the United States Department of Agriculture in February 2020, in 2018, agriculture, food, and related industries in the US created around 22 million jobs (about 11% of employment). These industries also contributed to 5.2% of the country's gross domestic product.
Investing in stocks or exchange-traded products (ETPs) in these industries may well add spice to long-term portfolios. Below are three ETPs providing exposure to the agricultural, food and beverage industries:
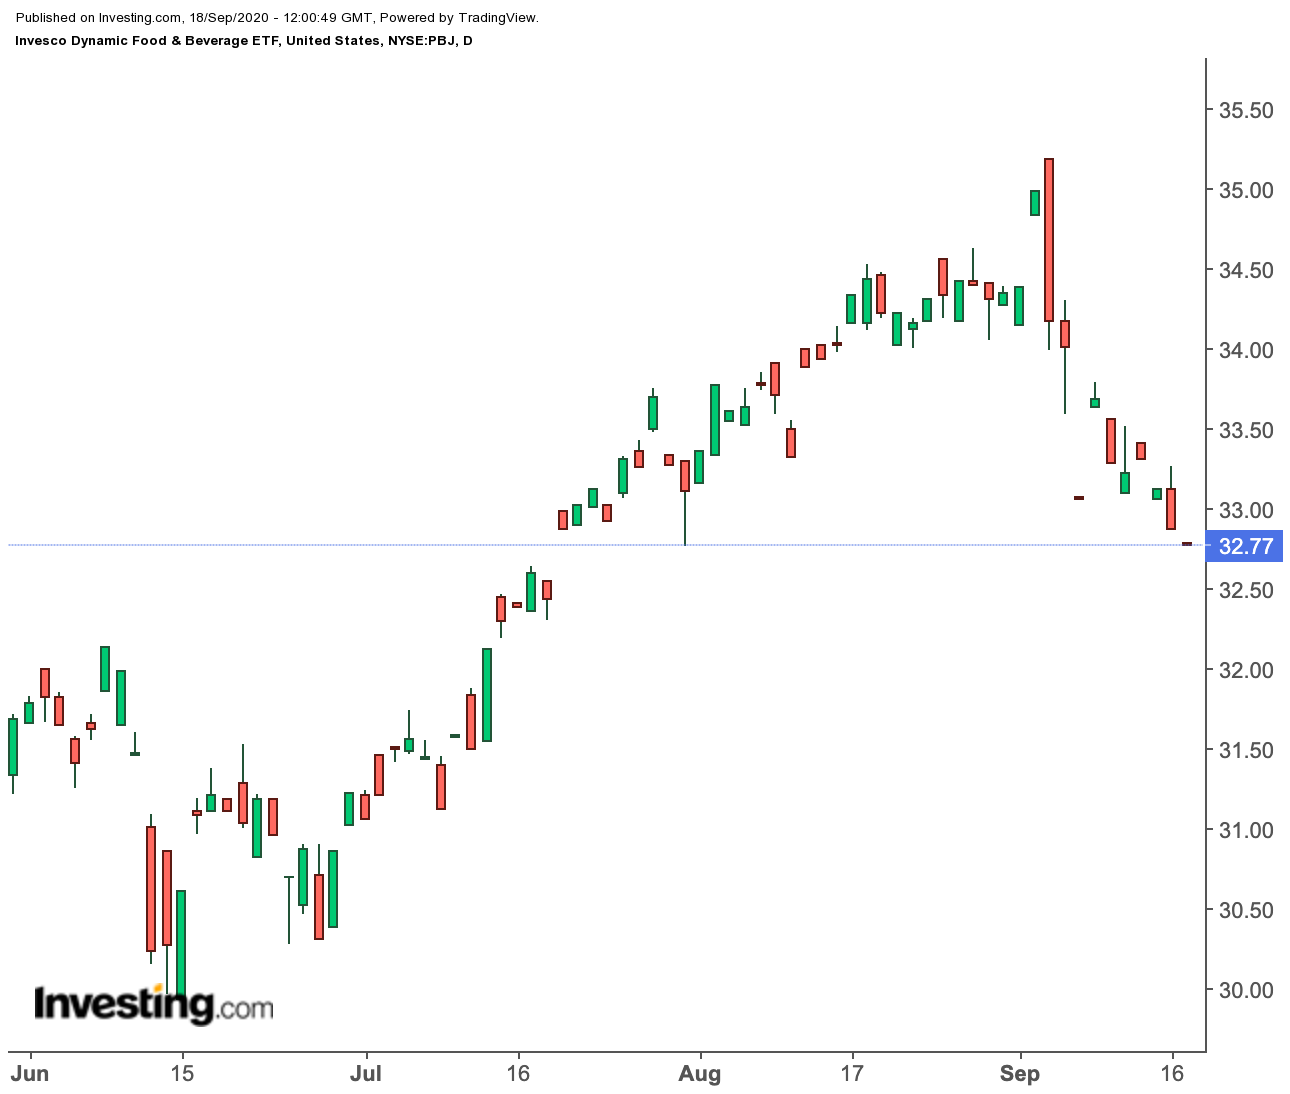
1. Invesco Dynamic Food & Beverage ETF
- Current Price: $32.77
- 52 Week Range: $24.44-$35.45
- Dividend Yield: 1.25%
- Expense Ratio: 0.65%
Invesco Dynamic Food & Beverage ETF (NYSE:PBJ) is composed of US food industry stocks, including 32 companies. PBJ tracks the equal-weighted Dynamic Food & Beverage Intellidex index.

The most important sectors (by weighting) are Food Processing (50.3%), Restaurant and Bars (17.68%) and Food Retail & Distribution (15.41%).
The top five holdings make up slightly over 25% of total net assets, which stand at $80 million. They include Brown Forman (NYSE:BFb), Mondelez International (NASDAQ:MDLZ), Monster Beverage (NASDAQ:MNST), PepsiCo (NASDAQ:PEP) and Hershey (NYSE:HSY).
Year-to-date (YTD), the fund is down about 5%. But the comeback since the 52-week low hit in mid-March has been impressive. As a result, the fund's valuation has also become rich. The trailing P/E and P/B ratios are 44.79 and 2.97, respectively. We'd ideally wait for a potential pullback toward the $30-level before investing for the long-run.
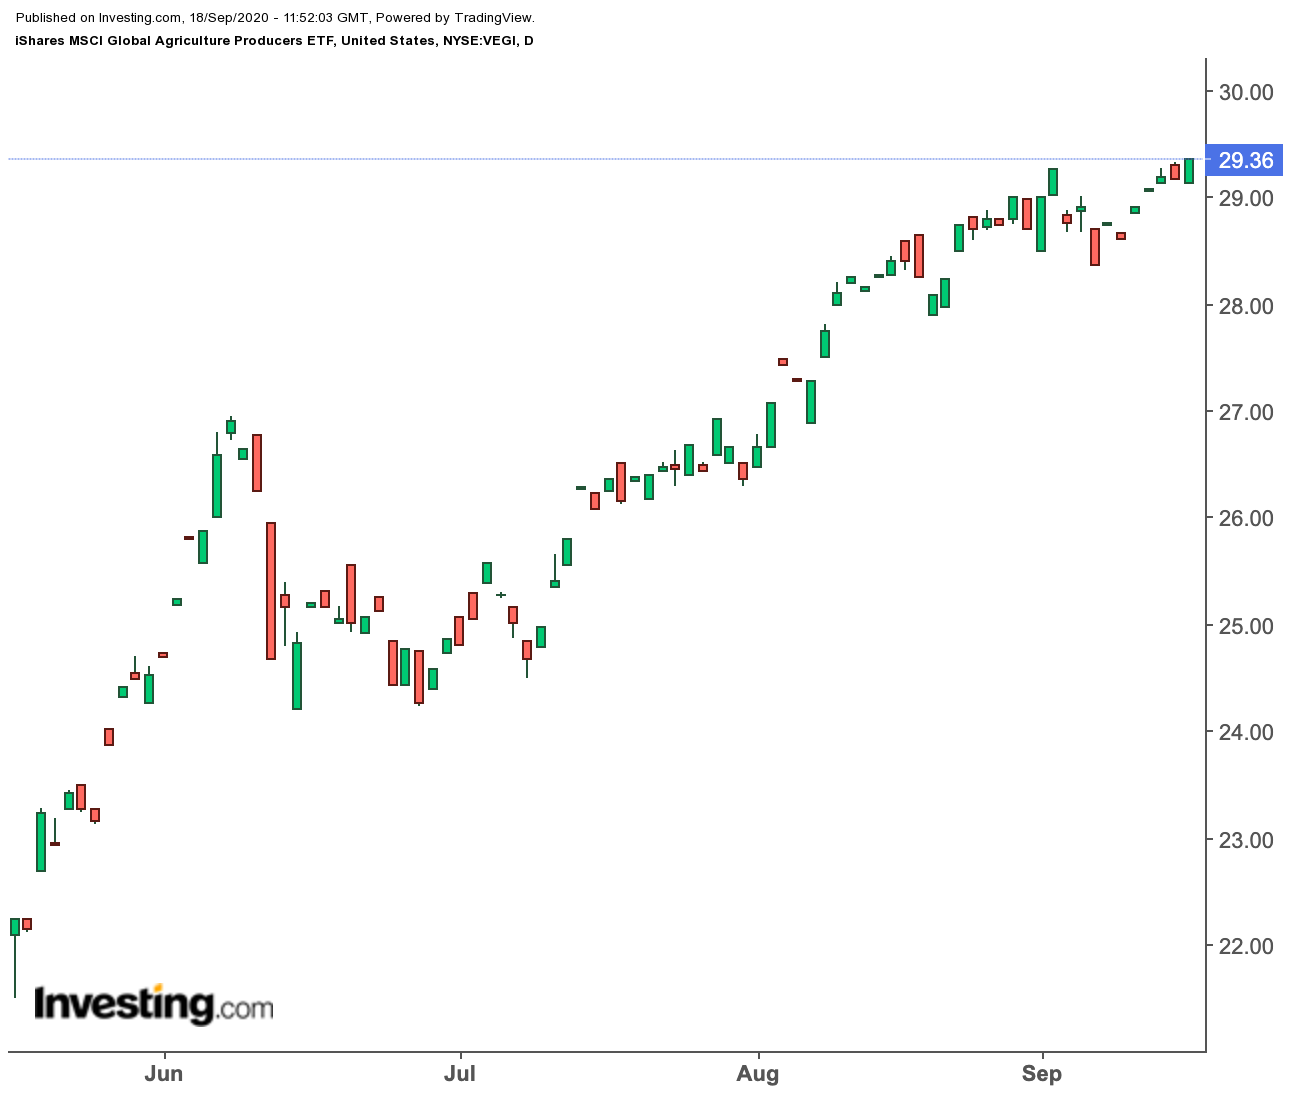
2. iShares MSCI Global Agriculture Producers ETF
- Current Price: $29.36
- 52 Week Range: $18.36-$29.38
- Dividend Yield: 2.63%
- Expense Ratio: 0.39%
The iShares MSCI Global Agriculture Producers ETF (NYSE:VEGI) provides exposure to a range of US and global agricultural businesses. These firms produce fertilizers and agricultural chemicals, farm machinery as well as packaged foods and meats.

The fund, which includes 136 companies, follows the MSCI ACWI Select Agriculture Producers Investable Market index. The top five holdings make up over 40% of its total net assets, which are close $28 million. They are Deere (NYSE:DE), Archer-Daniels-Midland Company (NYSE:ADM), Nutrien (NYSE:NTR), Corteva (NYSE:CTVA) and Kubota (T:6326).
YTD, the VEGI is up about 1%. In fact, on Sept. 16, it hit a 52-week high. Since early spring, VEGI is up over 90%. As a result, the trailing P/E ratio of 19.26 and P/B ratio of 1.85 are a bit on the expensive side. Any potential decline toward the $27.5 level would improve the margin of safety. Long-term, we're bullish on the sectors represented in the fund.
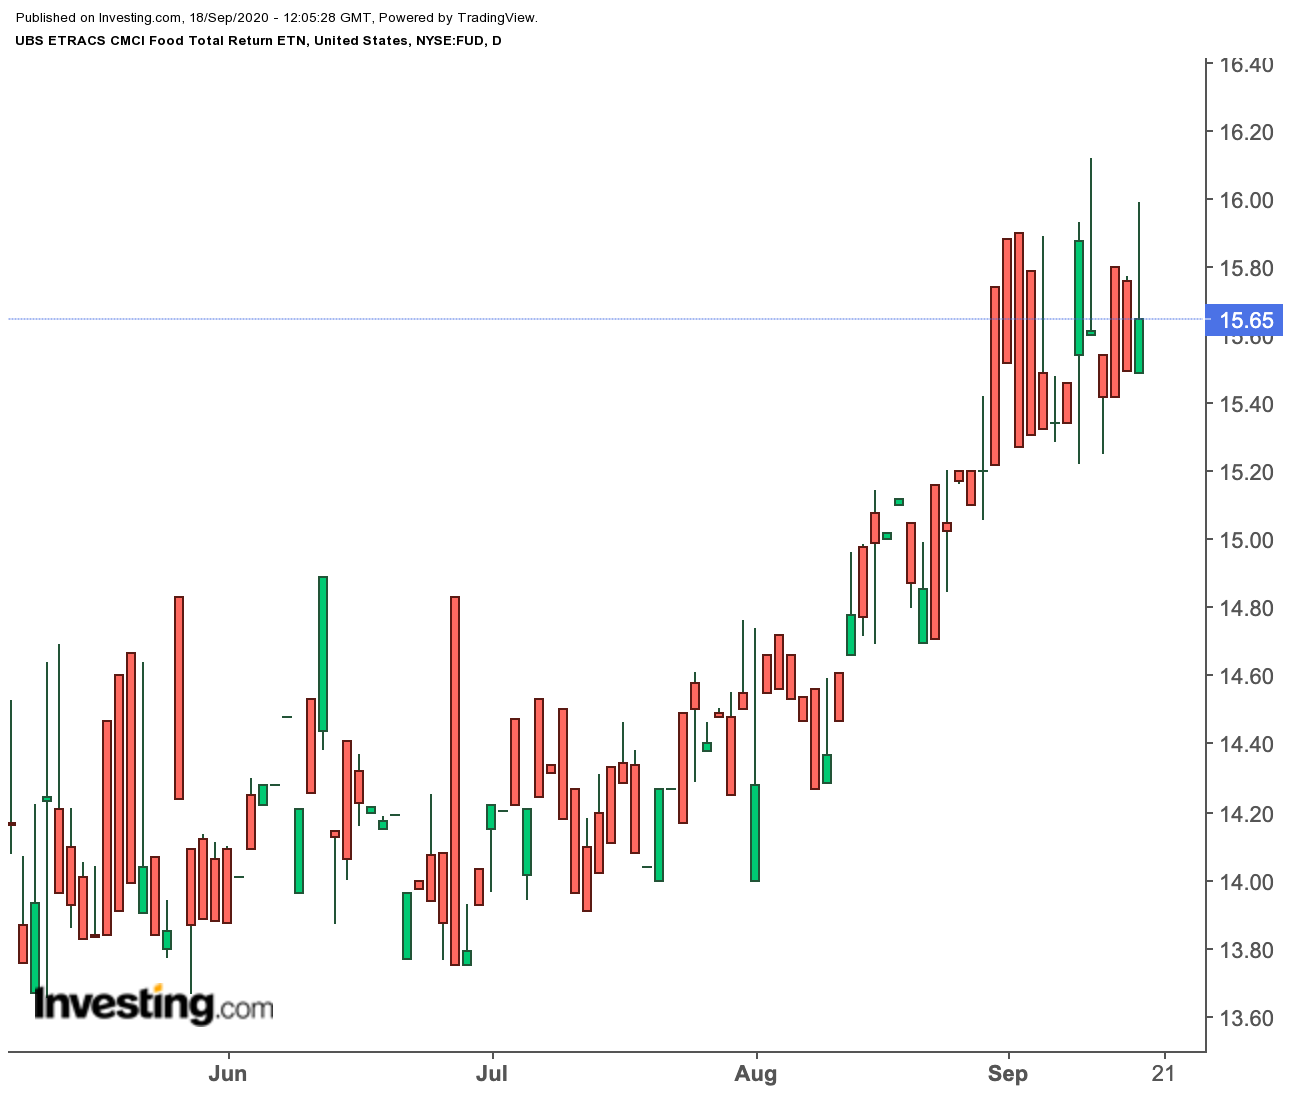
3. UBS ETRACS CMCI Food Total Return ETN
- Current Price: $15.65
- 52 Week Range: $13.63-$16.79
- Expense Ratio: 0.50%
Our final exchange-traded product is an exchange-traded note (ETN). The ETRACS CMCI Food Total Return ETN (NYSE:FUD) provides exposure to a portfolio of commodity futures, an unsecured debt security issued by a financial institution, such as UBS (NYSE:UBS). Therefore, investors do not buy shares, but rather hold a bond-like certificate indicating the debt of UBS to the holder of the note.

There are currently 11 futures contracts from the agricultural and livestock sectors. These commodity futures contracts vary across up to three constant maturities from three months up to one year.
FUD follows the UBS Bloomberg CMCI Food USD TR index, created in 2007. The top four commodities comprise over 55% of the ETN. They are Soybeans (19.62%), Sugar #11 (15.01%), Corn (14.69%) and Live Cattle (7.80%).
So far in the year, FUD is down around 6%. In fact, since 2010, the longer-term trend has been down. However, since the all-time low hit in March, the ETN is up around 15%.
Those investors interested in investing in agricultural and livestock commodities may want to study FUD more as well as pay attention factors influencing the industry. One good resource is the U.S. Department of Agriculture's monthly World Agricultural Supply and Demand Estimates (WASDE) Reports
The weather plays a significant role in grain prices. The trade war rhetoric between the US and China potential also had an impact on US agricultural exports. Longer-term demand for most of these commodities will possibly grow because of demographics, i.e., feeding an increasing global population.
