Deere & Company (DE)

Currency in USD
468.07
-0.25(-0.05%)
Real-time Data·
DE is not included in our AI-picked strategies. See which stocks are.
Fair Value
Day's Range
466.99470.15
52 wk Range
403.01533.78
Key Statistics
Prev. Close
469.94
Open
467.13
Day's Range
466.99-470.15
52 wk Range
403.01-533.78
Volume
377.72K
Average Volume (3m)
1.38M
1-Year Change
10.67%
Book Value / Share
95.99
Fair Value
unlockUnlock
Fair Value Upside
unlockUnlock
DE Scorecardpro icon
Company’s Health
Unlock
Fair Value
Unlock Price
Fair Price
Upside
Price Target
526.91
Upside
+12.57%
Members' Sentiments
Bearish
Bullish
ProTips
11 analysts have revised their earnings downwards for the upcoming period

Deere & Company News & Analysis

Show more

Technical Analysis

Summary
Strong Sell
Sell
Neutral
Buy
Strong Buy
Strong Sell
Technical Indicators
Strong Sell
Moving Averages
Strong Sell

Deere & Company Company Profile

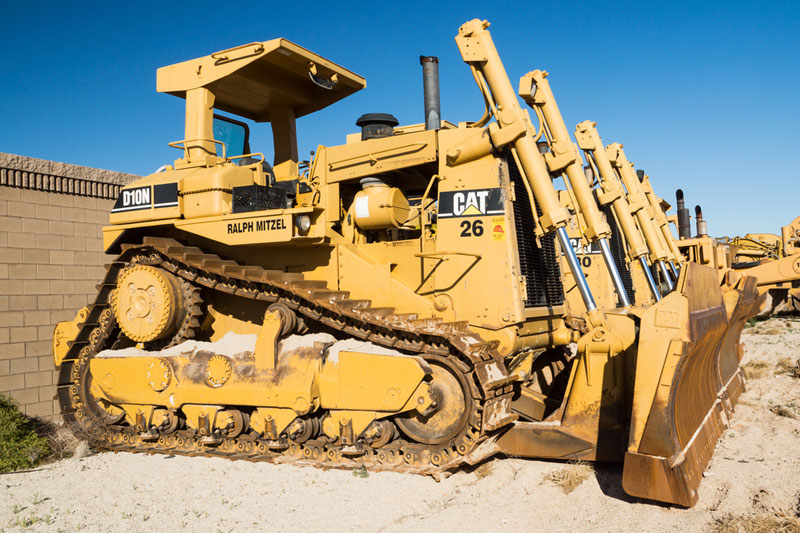
Deere & Company engages in the manufacture and distribution of various equipment worldwide. The company operates through four segments: Production and Precision Agriculture, Small Agriculture and Turf, Construction and Forestry, and Financial Services. The Production and Precision Agriculture segment provides four-wheel-drive track and row crop tractors, harvesters, cotton pickers and strippers, sugarcane harvesters and loaders, soil preparation, tillage, seeding, and crop care equipment, as well as application equipment, including sprayers and nutrient management, soil preparation machinery, and related attachments and service parts. The Small Agriculture and Turf segment offers specialty, utility, and compact tractors; self-propelled forage harvesters and attachments; rotary mowers, hay and forage equipment, and utility vehicles; turf and utility equipment, including riding lawn, commercial mowing, and golf course equipment, and utility vehicles, as well as implements for mowing, tilling, snow and debris handling, aerating, residential, commercial, golf, and sports turf care applications. The Construction and Forestry segment provides backhoe loaders, crawler dozers and loaders, four-wheel-drive loaders, excavators, motor graders, articulated dump trucks, skid-steer loaders, milling machines, recyclers, slipform and asphalt pavers, surface miners, compactors, tandem, static rollers, mobile crushers and screens, mobile and stationary asphalt plants, and log harvesters; and road building and rehabilitation equipment. The Financial Services segment finances sales and leases agriculture and turf, and construction and forestry equipment. It also offers wholesale financing to dealers of the foregoing equipment; and extended equipment warranties, as well as finances retail revolving charge accounts. The company was founded in 1837 and is headquartered in Moline, Illinois.

Deere & Company SWOT Analysis


Tech-Driven Growth
Deere's strategic focus on smart agriculture and precision technology positions it at the forefront of agricultural innovation, driving future growth and profitability
Financial Resilience
Despite cyclical market challenges, Deere maintains strong financial health with a solid return on equity and consistent dividend payments spanning decades
Global Expansion
Explore Deere's ambitious growth plans in South America, potentially adding billions to sales figures and diversifying its market presence beyond North America
Market Outlook
Analyst price targets range from $475 to $750, reflecting varied perspectives on Deere's ability to navigate tariff headwinds and capitalize on technological leadership
Read full SWOT analysis

Deere & Company Earnings Call Summary for Q4/2025

  • Deere & Company exceeded forecasts with Q4 2025 EPS of $3.93 and revenue of $12.4 billion (up 11% YoY), despite stock falling 4.97% to $477.06 pre-market
  • Net income reached $1.1 billion with equipment operations margins at 12.6%, driven by technology advancements and improved inventory management
  • For 2026, Deere projects net income between $4.0-4.75 billion but anticipates a 15-20% decline in large agricultural equipment demand in the U.S. and Canada
  • Company faces $1.2 billion pre-tax tariff impacts and various macroeconomic pressures, though executives highlighted record cycle performance
Last Updated: 2025-11-26, 11:36 a/m
Read Full Transcript

Compare DE to Peers and Sector

Metrics to compare
DE
Peers
Sector
Relationship
P/E Ratio
25.2x19.2x12.3x
PEG Ratio
−0.911.260.03
Price/Book
4.9x3.7x1.4x
Price / LTM Sales
2.8x1.6x1.3x
Upside (Analyst Target)
10.9%0.0%19.9%
Fair Value Upside
Unlock10.2%6.7%Unlock

Analyst Ratings

14 Buy
11 Hold
0 Sell
Ratings:
25 analysts
Overall Consensus
Buy

Analysts 12-Month Price Target:

Average 526.91
(+12.57% Upside)
Firm
ArticlePositionPrice TargetUpside / DownsideFrom Price TargetActionDate
JPMorgan
Hold460.00-1.69%480.00MaintainDec 19, 2025
BMO Capital
Hold460.00-1.69%-MaintainDec 09, 2025
DA Davidson
Buy580.00+23.96%-MaintainDec 09, 2025
Bernstein SocGen Group
Hold521.00+11.35%-MaintainDec 09, 2025
UBS
Buy535.00+14.34%535.00MaintainDec 09, 2025

Dividends

Payout Ratio
Payout ratio (TTM)
Earnings retained
EPS 18.50%
Dividend Yield
1.38%
Industry Median 1.62%
Annualized payout
6.48
Paid quarterly
5-Years Growth
+16.34%
Growth Streak

Earnings

Latest Release
Nov 26, 2025
EPS / Forecast
3.93 / 3.85
Revenue / Forecast
12.39B / 9.82B
EPS Revisions
Last 90 days

DE Income Statement

People Also Watch

51.06
NVO
-0.31%
80.04
RIO
-0.60%
353.22
SYK
-0.01%
1,078.76
LLY
-0.09%

FAQ

What Is the Deere&Company (DE) Stock Price Today?

The Deere&Company stock price today is 468.07

What Stock Exchange Does Deere&Company Trade On?

Deere&Company is listed and trades on the New York Stock Exchange stock exchange.

What Is the Stock Symbol for Deere&Company?

The stock symbol for Deere&Company is "DE."

Does Deere&Company Pay Dividends? What’s The Current Dividend Yield?

The Deere&Company dividend yield is 1.38%.

What Is the Deere&Company Market Cap?

As of today, Deere&Company market cap is 126.72B.

What Is Deere&Company's Earnings Per Share (TTM)?

The Deere&Company EPS (TTM) is 18.50.

When Is the Next Deere&Company Earnings Date?

Deere&Company will release its next earnings report on Feb 13, 2026.

From a Technical Analysis Perspective, Is DE a Buy or Sell?

Based on moving averages and other technical indicators, the daily buy/sell signal is Strong Sell.

How Many Times Has Deere&Company Stock Split?

Deere&Company has split 4 times.

How Many Employees Does Deere&Company Have?

Deere&Company has 73100 employees.

What is the current trading status of Deere&Company (DE)?

As of Jan 01, 2026, Deere&Company (DE) is trading at a price of 468.07, with a previous close of 469.94. The stock has fluctuated within a day range of 466.99 to 470.15, while its 52-week range spans from 403.01 to 533.78.

What Is Deere&Company (DE) Price Target According to Analysts?

The average 12-month price target for Deere&Company is USD526.91304, with a high estimate of USD724 and a low estimate of USD458. 14 analysts recommend buying the stock, while 0 suggest selling, leading to an overall rating of Buy. The stock has an +12.57% Upside potential.

What Is the DE Premarket Price?

DE's last pre-market stock price is 466.43. The pre-market share volume is 110.00, and the stock has decreased by -3.51, or -0.75%.
Risk Disclosure: Trading in financial instruments and/or cryptocurrencies involves high risks including the risk of losing some, or all, of your investment amount, and may not be suitable for all investors. Prices of cryptocurrencies are extremely volatile and may be affected by external factors such as financial, regulatory or political events. Trading on margin increases the financial risks.
Before deciding to trade in financial instrument or cryptocurrencies you should be fully informed of the risks and costs associated with trading the financial markets, carefully consider your investment objectives, level of experience, and risk appetite, and seek professional advice where needed.
Fusion Media would like to remind you that the data contained in this website is not necessarily real-time nor accurate. The data and prices on the website are not necessarily provided by any market or exchange, but may be provided by market makers, and so prices may not be accurate and may differ from the actual price at any given market, meaning prices are indicative and not appropriate for trading purposes. Fusion Media and any provider of the data contained in this website will not accept liability for any loss or damage as a result of your trading, or your reliance on the information contained within this website.
It is prohibited to use, store, reproduce, display, modify, transmit or distribute the data contained in this website without the explicit prior written permission of Fusion Media and/or the data provider. All intellectual property rights are reserved by the providers and/or the exchange providing the data contained in this website.
Fusion Media may be compensated by the advertisers that appear on the website, based on your interaction with the advertisements or advertisers.
© 2007-2025 - Fusion Media Limited. All Rights Reserved.