“There's no such thing as bad weather, just soft people,” Bill Bowerman, the co-founder of Nike and legendary Olympics track and field coach, once said.
Likewise, in natural gas, can we blame the weather or traders when bets go wrong?

Of course we can, as all trades ultimately boil down to human decisions—even algorithmic-driven ones, which, we must remember, are designed and commissioned by people.
But in financial market wagers, it’s hard, at least emotionally, not to fault the variables we count on when they lead us astray.
And anyone who has experience trading or following natural gas would know that weather patterns—or rather the forecasts around them—are king in determining how much of the fuel gets burned each week for heating or cooling and how much else goes into storage.
For weeks now, the promise of a balmy spring ushering in a comfortable thaw from winter chills has remained just that—a promise.
Weather Forecasters Misses Include ‘Insane’ Snow Storms
In the gas-dominated Northeast heating market, weather forecasts calling for steady April temperatures in the high 50 Farenheits and above proved dismally wrong, just like the Midwest snow storms late last month that some long-time folk there described as “insane.”
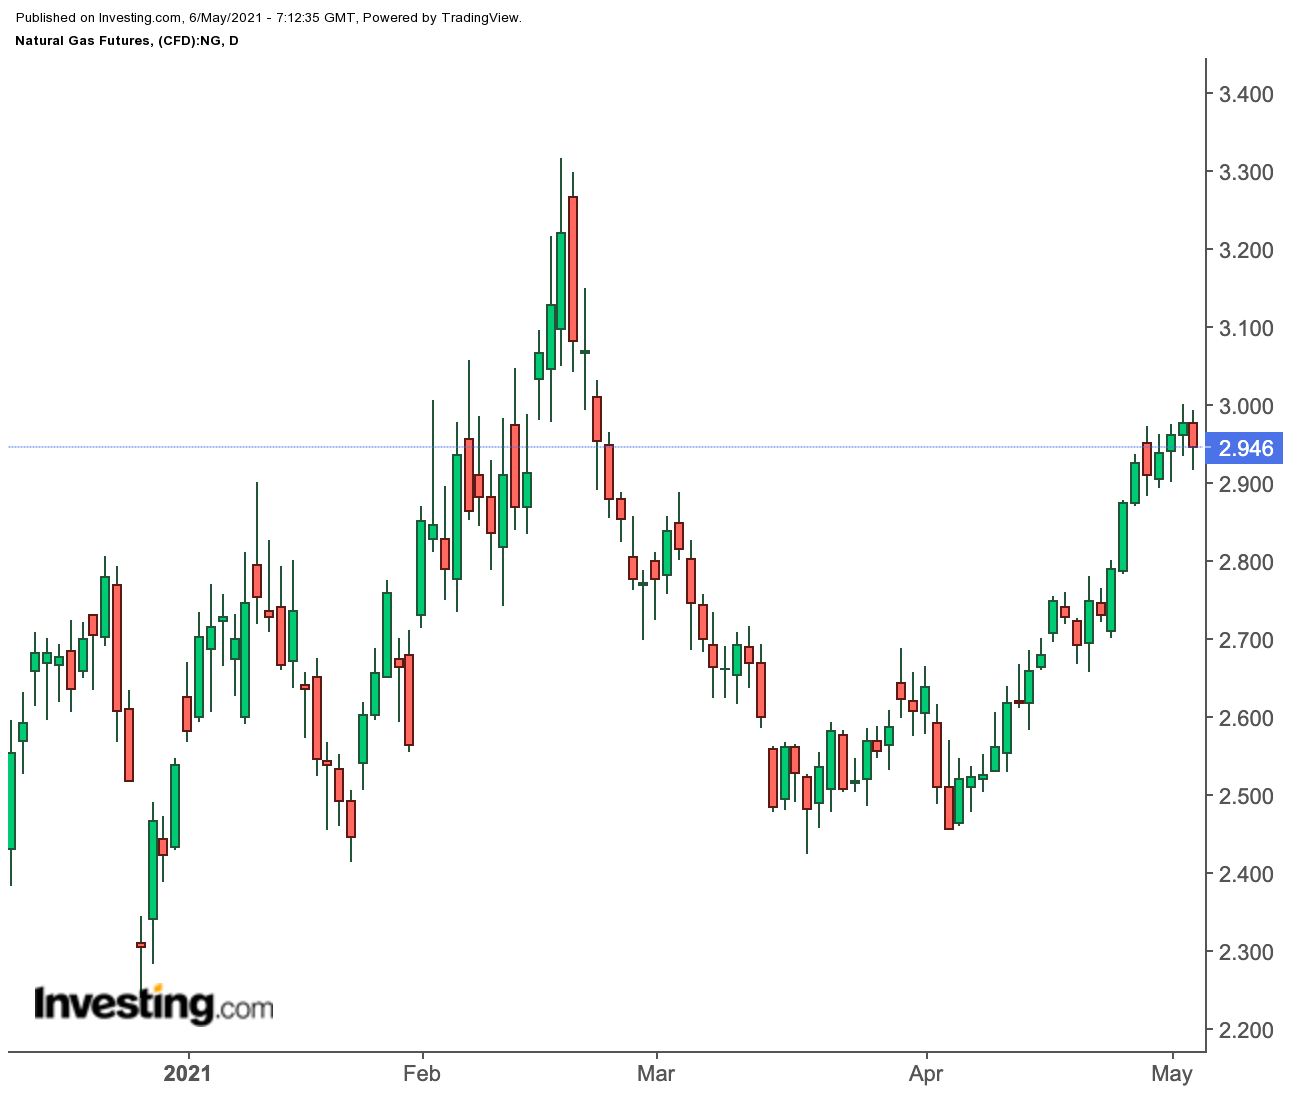
The culmination of these freak weather patterns resulted in natural gas’ largely unexpected price of near $3 per mmBtu, or million metric British thermal units, for this time of the year. The last time gas futures on the New York Mercantile Exchange’s Henry Hub traded this high for May was in 2018.
The phenomenon associated with this abnormality has been the weekly storage reports of natural gas from the Energy Information Administration. On three of the last five occasions, the EIA has wrong-footed consensus estimates from analysts betting on larger gas injections into storage.
With the agency’s latest weekly report due at 10:30 AM ET (14:30 GMT) today, analysts are calling for a storage build of 64 bcf, or billion cubic feet, last week compared to the previous week’s addition of 15 bcf.
A year ago, during the same week, utilities injected 103 bcf into storage. The five-year (2016-2020) average for injections was, meanwhile, 81 bcf. That would make the latest forecast lower relatively despite being at least four times larger than the previous week.
Front-month gas for July delivery on the Henry Hub settled down 3 cents, or 1%, at 2.938 per mmBtu on Wednesday. Week-to-date, it is up 0.4%, after a 12.7% gain for April—the highest for a month since the near 33% seen in October.
Compared to a week ago when contracts from July through February 2022 were trading above $3 per mmBtu, on Wednesday that honor was shortened for the period between November and February.
Charts Suggest Resistance Peaking At Just Above $3
Technical charts of natural gas, meanwhile, suggest more upside in the near term.
Investing.com’s Daily Technical Outlook continues to rate the July gas contract a “Strong Buy,” forecasting a three-tier Fibonacci resistance that begins at $2.980, then moves up to $2.998 before peaking at $3.03.
Thus, Houston-based gas markets consultancy Gelber & Associates cautioned its clients to be on the alert for surprises in the EIA report and the impact those could have on the relatively strong gas futures.
“As far as storage is concerned, injections up to the week of May 14 appear relatively mild, with forecasted injections falling under their respective five-year averages due to stronger than expected weather,” the consultancy said in an email to its clients
“(The week to) May 21 is predicted to provide natural gas storage its first 100+ bcf injection for this season,” it added.
According to data provider Refinitiv, there were 46 HDDs, or heating degree days, last week compared with the 30-year average of 54 HDDs for the period.
HDDs are used to estimate demand to heat homes and businesses and measure the number of degrees a day's average temperature is below 65 degrees Fahrenheit (18 degrees Celsius).
One reason the Henry Hub’s front-month has been able to stay near $3 is that total gas in storage now stands at just around 1.96 tcf, or trillion cubic feet—almost 3% below the five-year average and nearly 15% below year-ago levels.
Also production averaging at 90.6 bcf daily, versus the March level of 90.8 bcf per day reduced gas storage for April.
In April, the amount of gas that flowed to export plants for LNG, or liquefied natural gas, rose to a monthly record 11.5 bcf per day. Pipeline flows to Mexico hit an all-time monthly high of 6.1 bcf daily.
More Output On The Way, At Least Based On Rig Counts
But higher production of gas may be coming, Gelber & Associates said.
It said US rig counts in dry gas plays were showing remarkable improvement, with those in the Haynesville, Marcellus and Utica shale regions not only stabilizing but also recovering from serious pandemic-era declines.
It noted that the Haynesville currently contained 45 rigs, while the Marcellus and Utica command 29 and 10 rigs, respectively.
“For reference, rig counts have not been this high since late January of last year. Recent natural gas price rallies may convince producers to deploy additional rig crews into the fields for the next few weeks,” the consultancy said.
“Given that rig counts typically lag natural gas prices, it is likely that the around $2.96 per mmBtu prices observed of late will inspire rig counts in dry gas plays to steadily climb higher.”
Disclaimer: Barani Krishnan uses a range of views outside his own to bring diversity to his analysis of any market. For neutrality, he sometimes presents contrarian views and market variables. He does not hold a position in the commodities and securities he writes about.
