
The headline Employment Change for September was released at 53,700 today versus a market expectation of 10,000 and 81,100 last month. The unemployment rate is 5.5% versus 5.7% expected and 5.7% last. Average hourly wages (YoY) for September also increased 4.3% over August’s number vs 3.8% expected. This is a breath of fresh air for the Canadian economy, which released weaker inflation data and weaker retail sales data late last month.
The Bank of Canada now has their hands full. The BoC will have their next policy meeting on Oct. 30 (which happens to be the same date as the next FOMC policy meeting) where they will release their projections for the economy as well. At the last meeting, BoC chairman Stephen Poloz stated that “the current degree of monetary policy stimulus remains appropriate.” Will this still be true?
A rise in employment and earnings, combined with weaker retail sales and lower inflation will make this a tough decision for Poloz and company (note that we will see inflation data one more time before the Oct. 30 meeting).
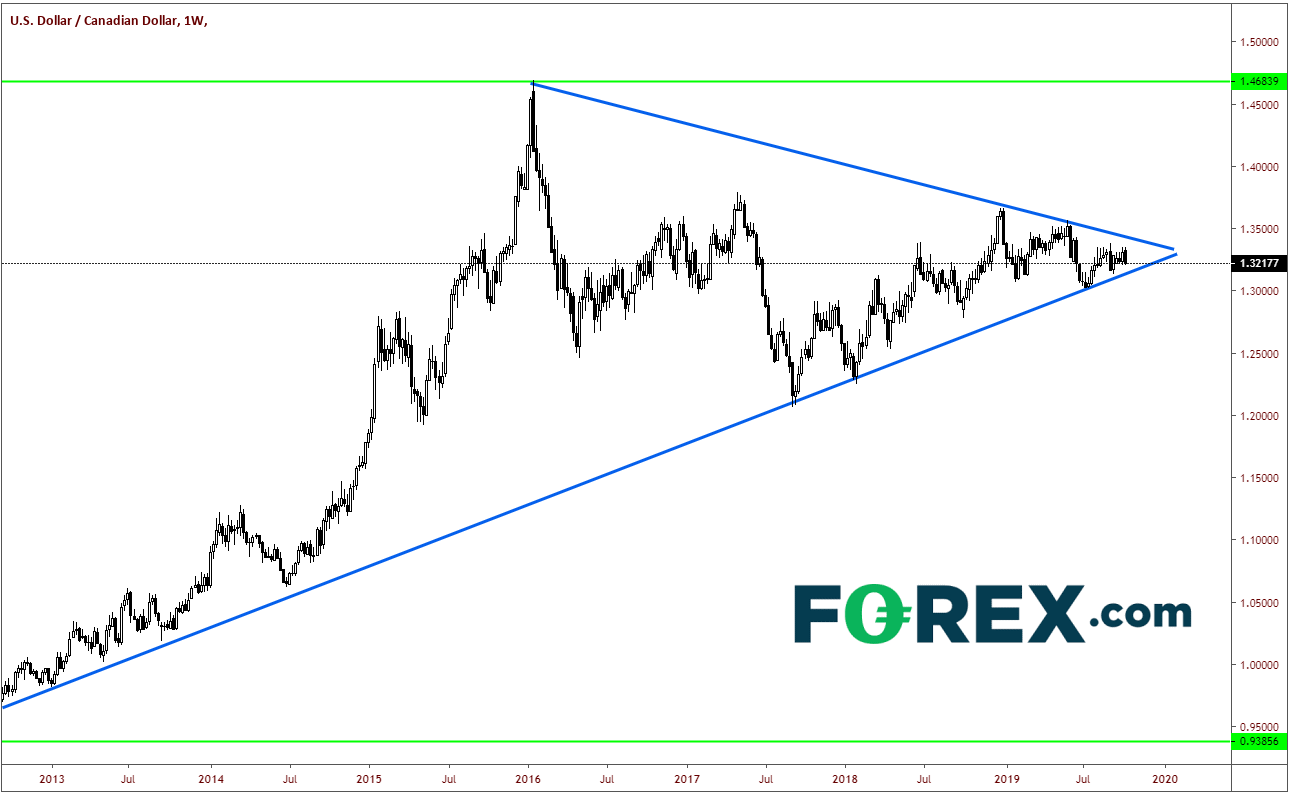
Let’s quickly remind ourselves of where we are on the weekly chart in USD/CAD. We have been in a long-term symmetrical triangle and are currently coiling at the apex. A breakout through either trendline could provide direction over the long term.
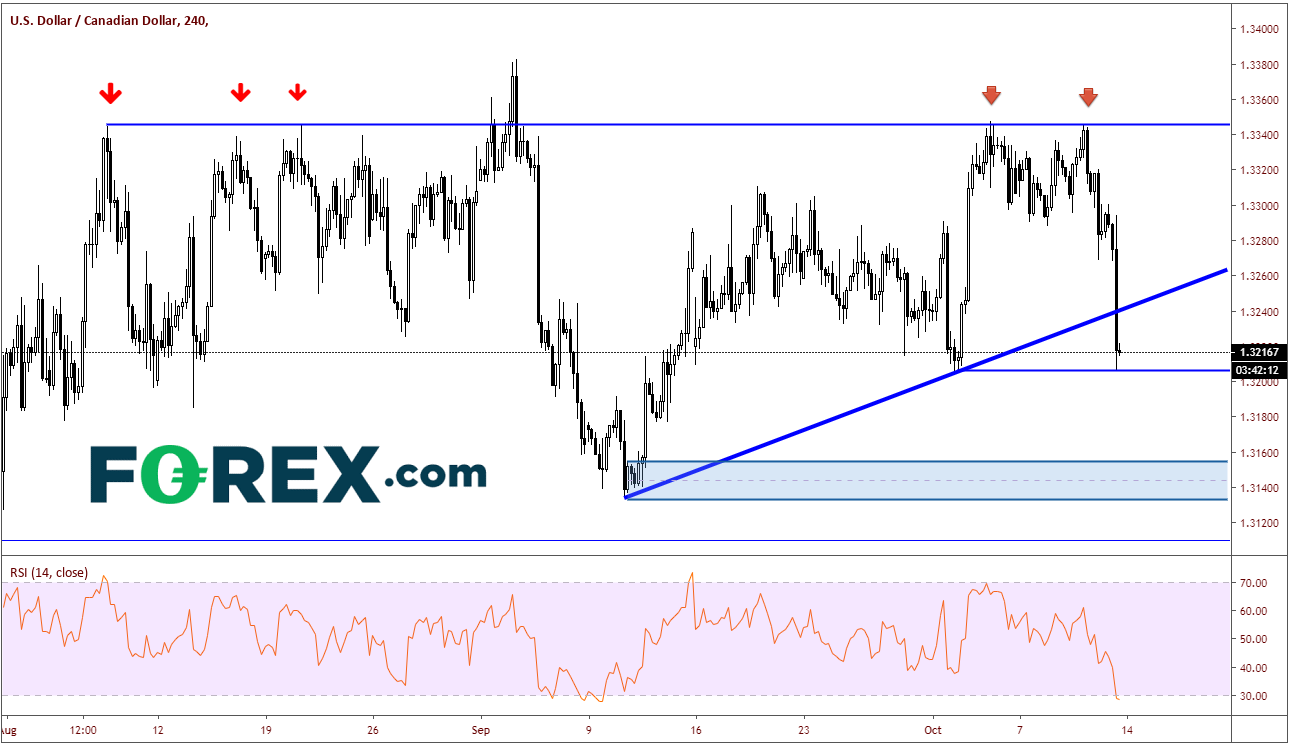
On a 240-minute chart, price failed numerous times to stay above 1.3350, and upon release of today’s employment data, spiked lower through and upward sloping trendline going back to Sept. 10. For the moment, USD/CAD is holding previous lows near 1.3200. Next support zone is between 1.3150 and 1.3130, prior lows from mid-September.
However, on a daily chart, we get a better picture of the horizontal support and the rising weekly trendline near that 1.3130/50 level. If price breaks through these levels, USD/CAD can push much lower towards the 1.2000/1.2300 levels over the lower term.
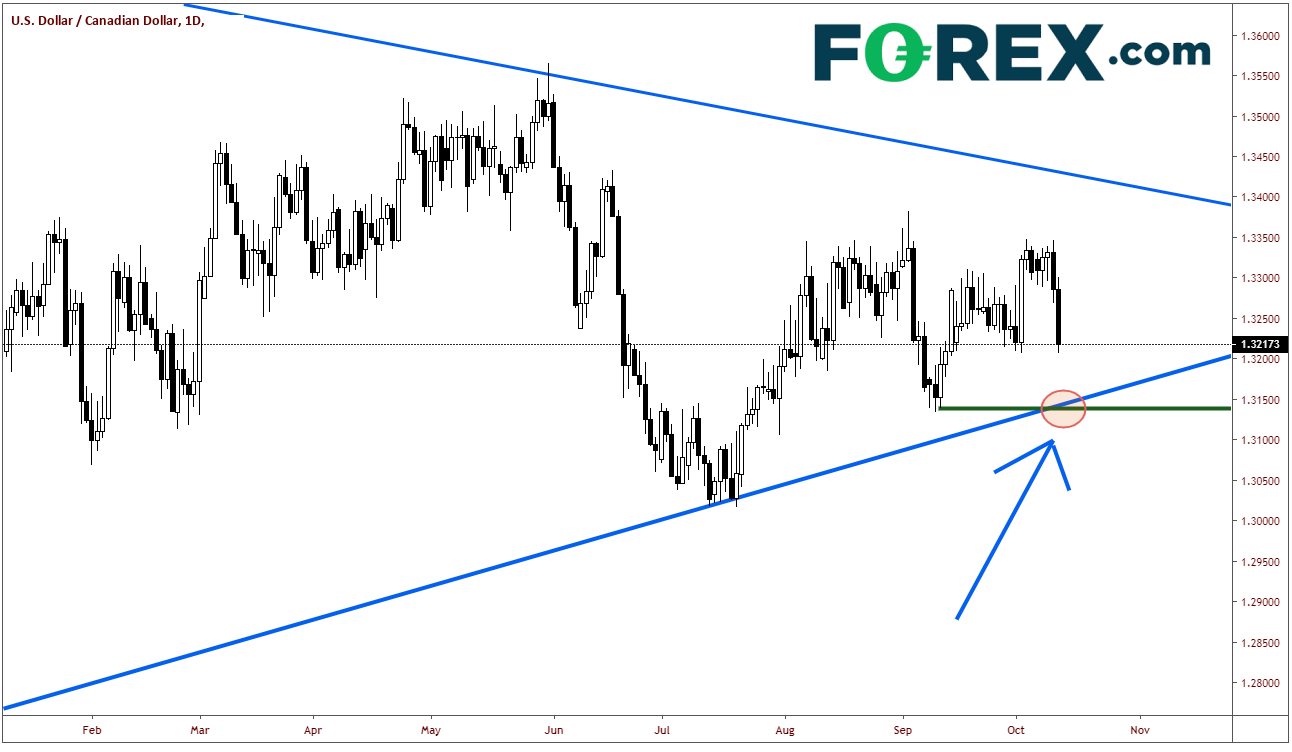
Resistance comes in above at the break of the trendline near 1.3240 and above that near prior lows (which now act as resistance) near 1.3270.