Crypto aficionados experienced some drama yesterday when speculation surfaced that Bitcoin's pseudonymous creator, Satoshi Nakamoto, who mined the "Genesis Block" of early BTC, had sold his holdings. The rumor began when it was reported that a dormant batch of the digital currency, from a previously inactive address dating back to the blockchain's earliest days, had changed hands.
In a single hour, Bitcoin plunged, dropping 7%. Though the selloff eased, early today the cryptocurrency's selloff extended amid wild gyrations. Indeed it's been fluctuating as we write this.
If prices should remain lower today, it would mark the first back-to-back decline for Bitcoin since the four-day selloff that ended on May 11. In what seems a counterintuitive move, the end of that selloff marked the start of the digital currency's halving. Bitcoin is up almost 14% since then, even after the current, two-day, 5.1% drop.
From a technical perspective, now may be the ideal time to buy Bitcoin.

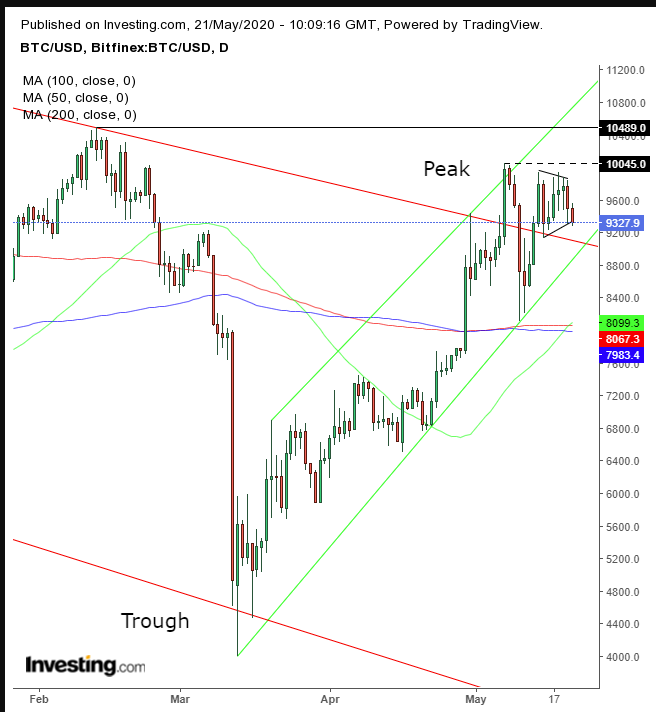
As we said above, even after the halving, the largest cryptocurrency by market valuation broke the topside of a falling channel since June, for the second time since the fakeout penetration on May 7, when the price plunged almost 19% ahead of halving.
After the current two-day drop, Bitcoin is still above the falling channel, for a ninth session, shaking out traders not committed to sticking to their guns—especially after the breakout failure of May 7.
The price, even after the decline, remains within a pennant formation, bullish after the 21% surge that preceded it. Of particular interest, the price dipped slightly, taking it temporarily below the pattern’s bottom but climbed back above it and is now precisely on top of the continuation pattern’s bottom, providing aggressive traders a rarely seen opportunity from a risk-reward perspective.
The presumptive dynamics of the pattern is a give-and-take among traders who are currently on opposing sides, not necessarily because of outlook but the result of timing. While the buyers are obviously bulls, it's believed the sellers share that sentiment. However, they want to realize gains after the asset added a fifth to its value, before momentum turns around.
The upside breakout would demonstrate that demand is strong enough for another leg higher, pulling back in all the early bulls and creating a self-fulfilling prophecy.
The 50 DMA crossed above the 200 DMA, triggering a Golden Cross, adding gravitas to the bulls along the rising channel since the March bottom, at the expense of the bears along the falling channel since the June high.
While the RSI fell below its uptrend line (red), and even confirmed its resistance with a failed attempt to climb back above it, it has been maintaining its uptrend line (black) since April 21, a full month. We are less concerned about the failure to maintain the longer uptrend line, as the momentum-based indicator would naturally fall when supply and demand evens out within the range, especially after one-sided demand dominated the preceding move. We are encouraged that it maintains its levels amid the pennant development, and well as before.
The ROC, another momentum indicator, demonstrates that momentum was higher going up – as it scaled above its previous peak, when the price was even higher, when the pattern began to develop.
The MACD, a lagging indicator, is still in bearish formation, as prices are, in fact, lower than they had been when the pattern started to form.
Note: This might be an appropriate time to clarify that Bitcoin is still in a downtrend. It will turn into an uptrend only after it forms two rising peaks and troughs, which will register new highs above the February highs, below $10,500.
Trading Strategies
Conservative traders would enter a long position after Bitcoin posts an ascending series of peaks and troughs and closes above $10,2500, which may prove to be the last peak in the downtrend.
Moderate traders are almost certainly going to jump in after an upside breakout extends the rising channel since the March bottom.
Aggressive traders now have an ideal position to go long, as the price affords a rare, favorable risk-reward ratio, resting on the bottom of a presumably bullish pattern. Aggressive traders are the most disciplined, and only follow a meticulously detailed plan, no matter what. Anything else is just gambling.
Trade Sample
- Entry: $9,300
- Stop-Loss: $9,000 – psychological, round number, below the intersection between the cross trends.
- Risk: $300
- Target: $10,500
- Reward: $1,200
- Risk:Reward Ratio: 1:4
