This article was written exclusively for investing.com
After Thursday’s stronger close, US tech futures have risen and point to a higher open on Wall Street. The markets haven’t moved too much this week, and consolidation after a big two-week rally is never a bad thing from a bullish point of view.
So, while it may feel like equity investors are more concerned about the new lockdown measures to stop the spread of the coronavirus than they are hopeful about prospects for a vaccine, the underlying bullish trend still remains intact. As such, I have identified 3 tech stocks that look quite bullish. So, without further ado…
Snap
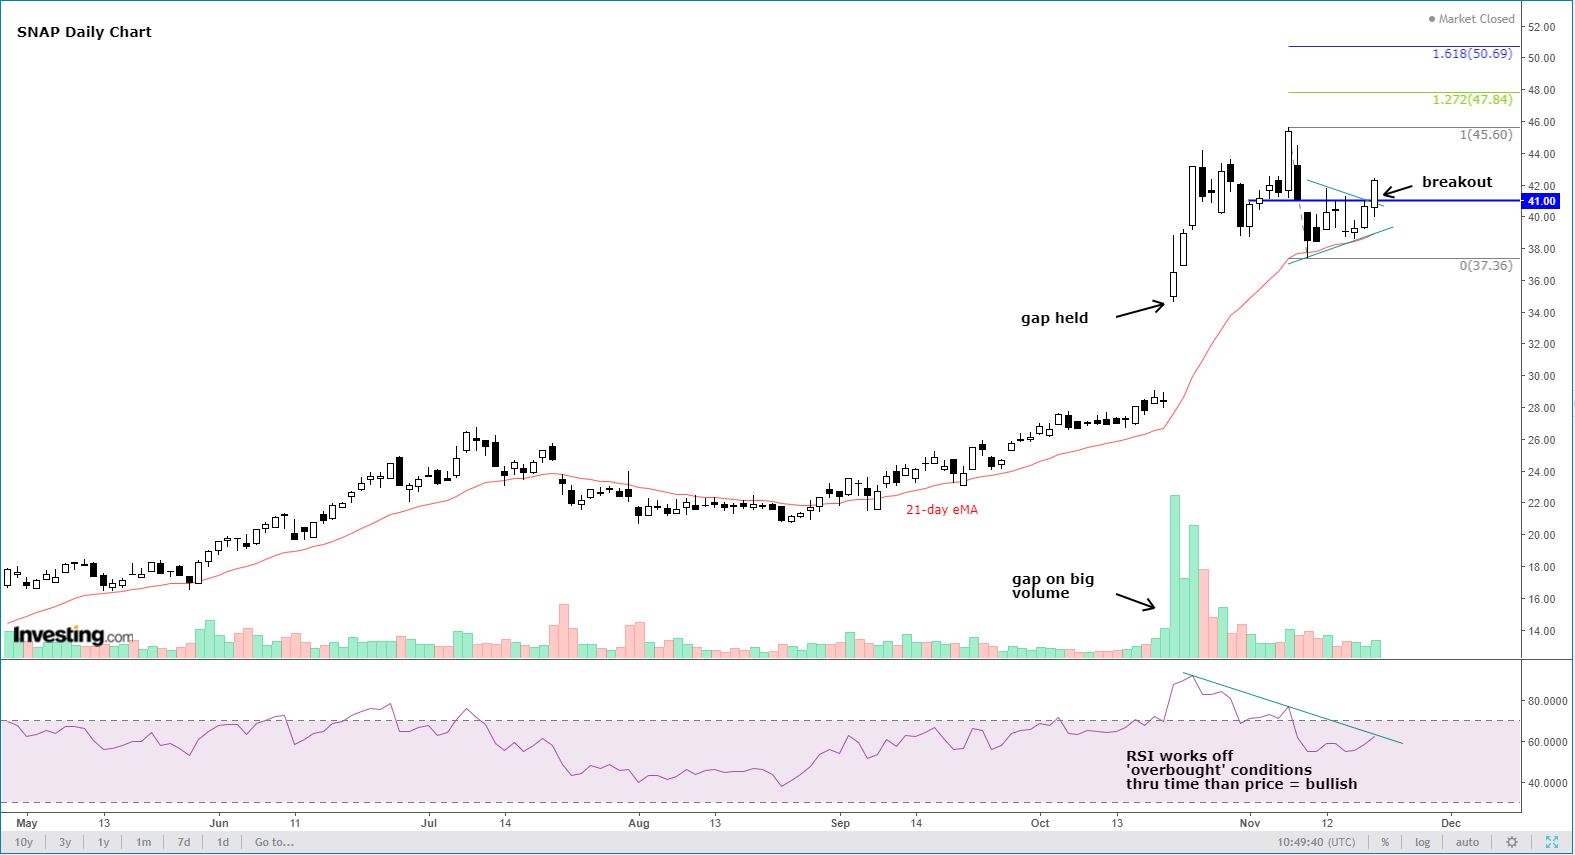
After gapping sharply higher on BIG volumes on the back of its earnings results a month ago, shares in Snap (NYSE:SNAP) have managed to hold comfortably above the gap and now look ready to break out further higher.

As the stock has managed to hold near its all-time high for about a month now, momentum indicators such as the Relative Strength Index (RSI) have worked off their ‘overbought’ conditions through time rather than price action (i.e. a sell-off). This is a further bullish sign, as it suggests that the buyers have remained in control of price action and that the stock is no longer overbought, meaning momentum-chasing bullish speculators could now think about stepping in again to help accelerate the potential up move, especially given the breakout above the triangle pattern on Thursday.
Furthermore, the stock has not closed below the 21-day exponential moving average ever since snapping above it in late August. Key short-term support comes in at $41, which needs to hold on a closing basis to maintain the bullish bias. Some of the bullish objectives include the area just above the all-time high of $45.60, above which a cluster of trapped sellers’ buy stop orders would surely be resting. Beyond that level, the 127.2 and 161.8 percent Fibonacci extension levels come in at $47.84 and $50.70 respectively.
eBay
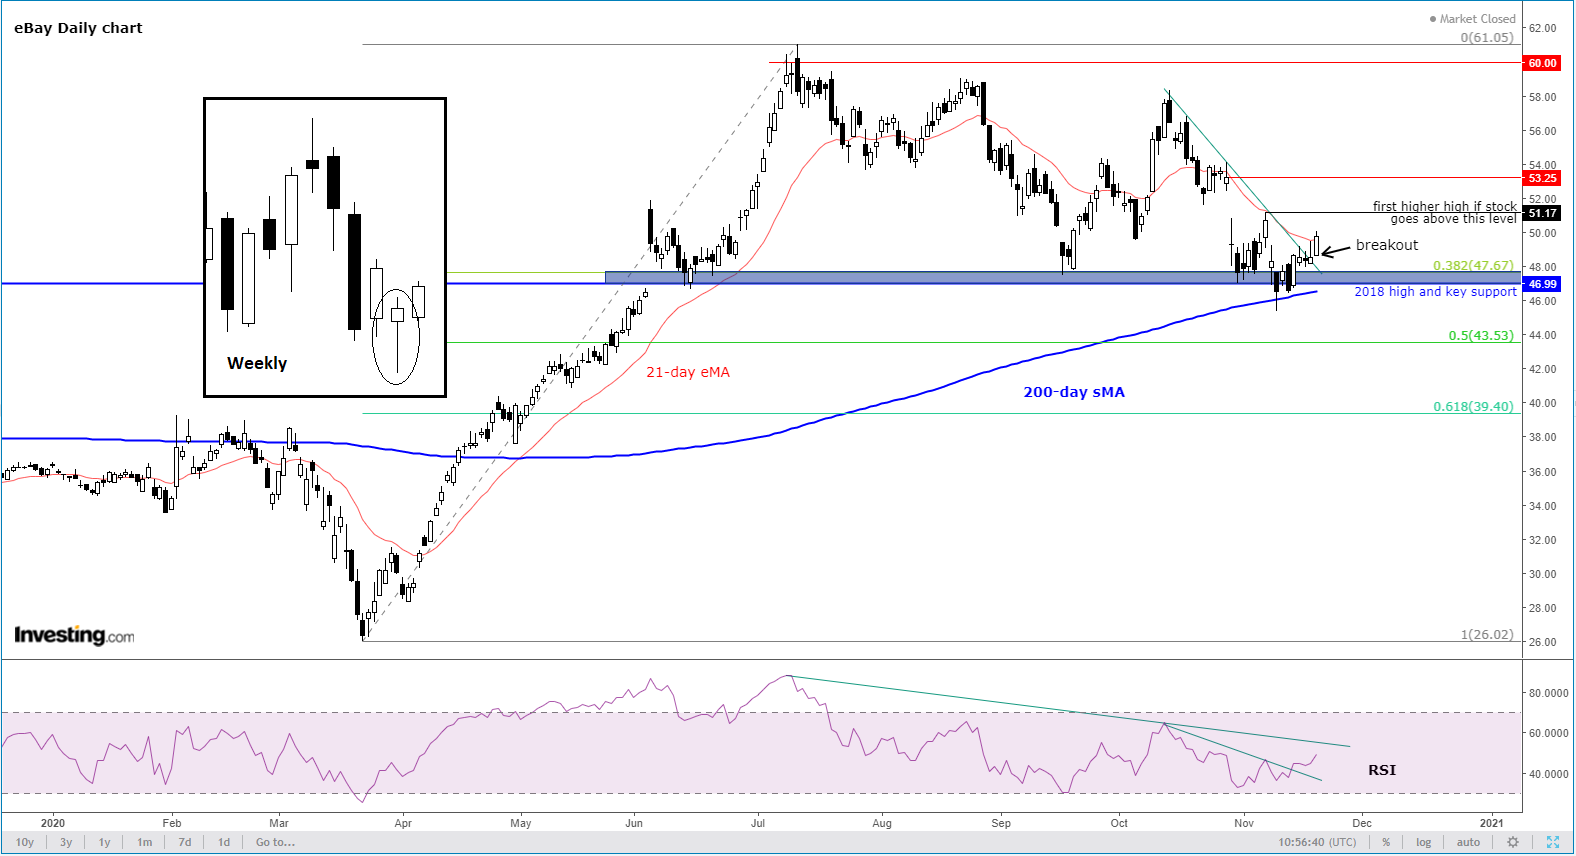
After breaking to a new record high back in July, eBay (NASDAQ:EBAY) has struggled. But now it is looking bullish again from a technical point of view. The stock held its own above the still-rising 200-day moving average earlier this month. What’s more, key support at $47.00, which was also the high back in 2018, was also defended by the bulls.
With the stock this week rising above its short-term bearish trend line, the path of least resistance is thus objectively to the upside again. More confirmation could be on the way if eBay now rises above its most recent high at $51.17 to make its first higher high since mid-October.

It is worth pointing out the stock also created a nice-looking weekly hammer candle in the previous week, and it is now trading above it. Some of the targets include the gap close at $53.25, followed by prior resistance around the $60.00 area, with the all-time high coming at just north of the $61.00 level.
Meanwhile, the fact that the stock managed to hold the relatively shallow 38.2% Fibonacci retracement against the move up from its March low is a further indication that buyers are still in overall control and that traders can expect a stronger upside continuation from here than would have been the case in the event of a deeper retracement (e.g. to the 61.8% level or higher).
Alibaba
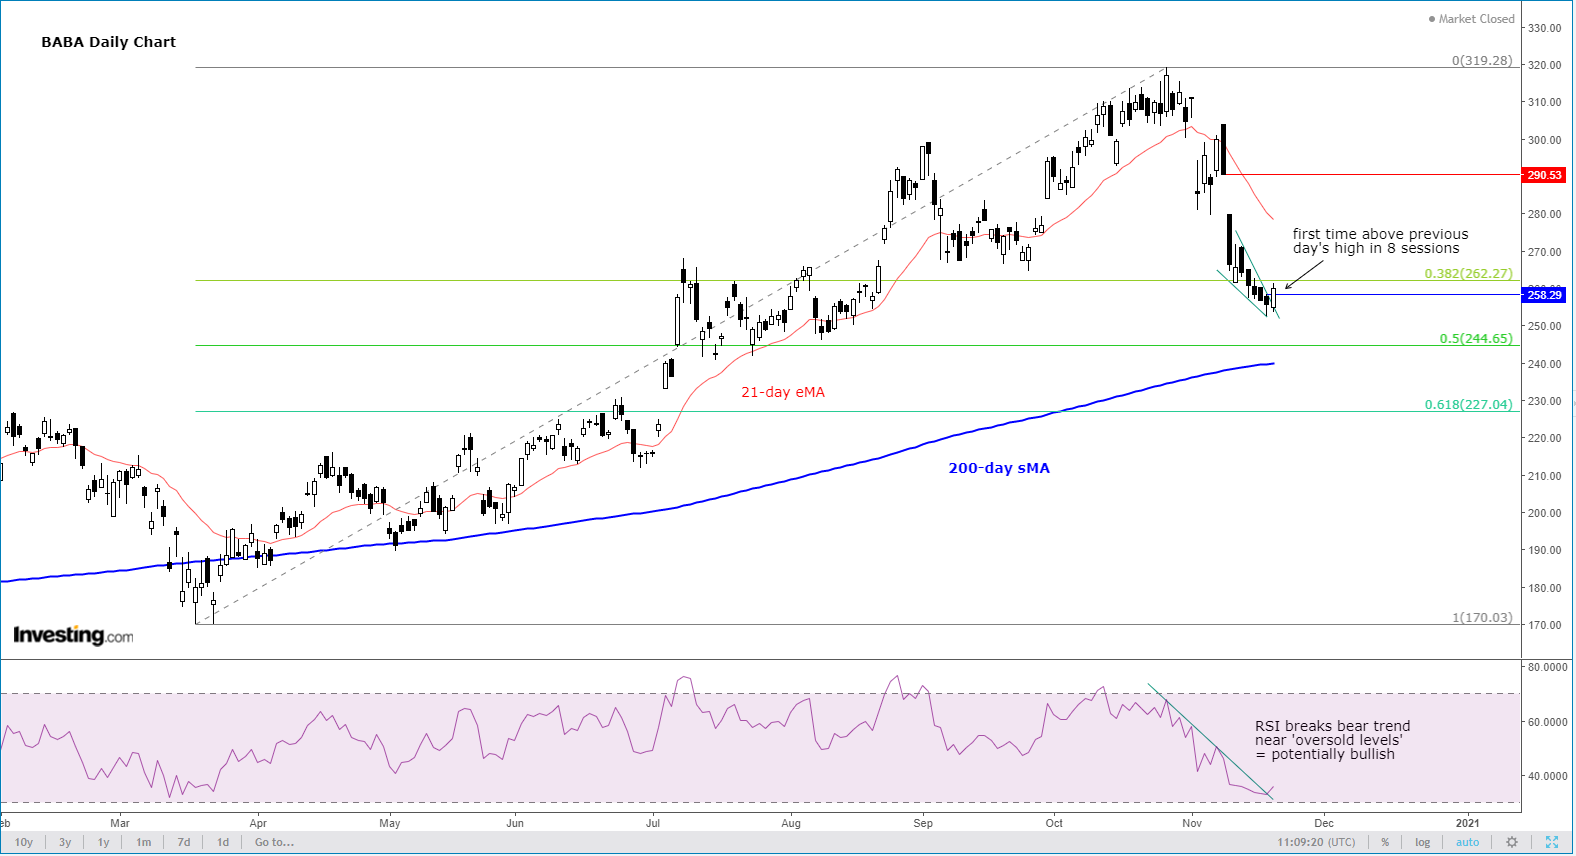
Out of the three stocks, Alibaba (NYSE:BABA) looks the weakest link but it too has formed a potential bullish signal after the stock snapped a run of consecutive red sessions on Thursday, when it rose above the previous day’s high for the first time in 8 trading session.

The rebound has turned the weekly candle into a doji/hammer, which would be confirmed unless it closes in the red today. So, overall, it looks like it is staging a potential reversal here.
