Apple (NASDAQ:AAPL) is set to release its fourth quarter corporate results Thursday after market close. Analysts are falling over themselves in praise of the stock's fundamentals.
Expectations are that Apple will hit the ball out of the earnings park. The EPS and revenue forecasts are for $2.78 and $61.35 billion, respectively.
Investors are also counting on the release of a number of new products including the newest version of the MacBook Air as well as the redesigned iPad Pro, both of which were unveiled yesterday, each at a higher price point, ahead of the holiday shopping season.
Still, even with the upgrades to its computer technology, introduced just weeks after the unveiling of Apple's most recent iPhone iterations, savvy investors can't help but wonder if shares of the stock will be able to buck the FAANG—as well as the broader market—downtrend, no matter how steller Apple's Q4 results might be.

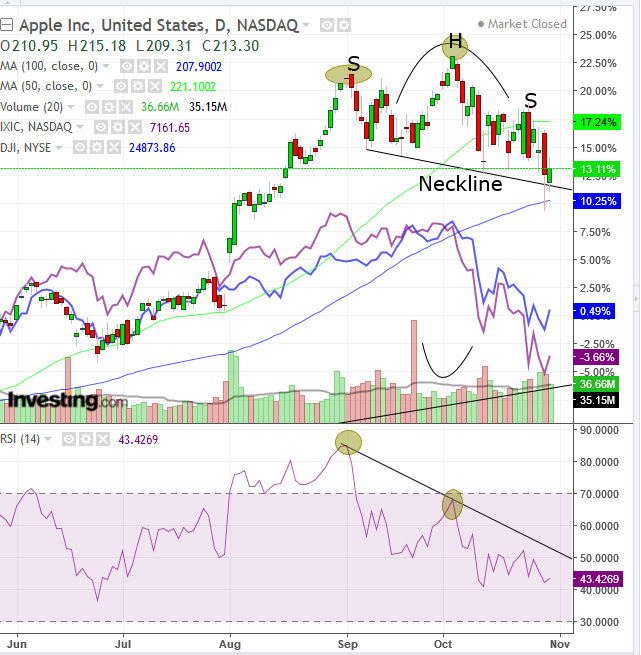
As is made clear in the chart above, Apple has been beating both indices on which it's listed, the NASDAQ (purple) and the Dow (blue). However, its weakness is also visible, even if that's only due to the fact that Apple got dragged down by the general equity fire-sale.
While long term investors might consider the company a worthwhile, buy-and-hold investment, they might also be hesitant to enter after the stock hit a record high, as it did in early October. Additionally, it's showing signs of a top, alongside the averages.
After the record high, adding a peak to the October 3 uptrend at $233.47, a red flag flashed when prices dipped below the previous low of $215.30, posted September 19. Then, again, when the October 23 rally failed to hold and prices dipped even lower until Monday, piercing through the trend line connecting all those lows, the neckline of a down sloping H&S top.
Note negative divergences in both volume and momentum. Volume dried up in the formation of the head and the RSI declined while the price peaked.
A down-sloping neckline is particularly weak. It signals there was not even enough demand to formulate a right shoulder on the same level of the left shoulder but over 2.5 percent lower.
Trading Strategies
Conservative traders should wait for a new high to form, in order to take a long position or for the long-term uptrend since the 2009 bottom to reverse.
Moderate traders would wait for a resumption of the uptrend as well, or for the moderate downtrend to end.
Aggressive traders may short with a close below the neckline, preferably below yesterday’s 209.31 low which would include falling below the 100 DMA (blue), after having already fallen below the 50 DMA.
Trade Sample
- Entry: $205, upon a return move
- Stop-loss: $210
- Risk: $5
- Target: $190
- Reward: $15
- Risk-Reward Ratio: 1:3
