"And they lived happily ever after” is the stuff of fairy tales. But in the real world, the newly created AT&T (NYSE:T)/Discovery (NASDAQ:DISCA) media group threatens to eat into the market now occupied by the Walt Disney Company (NYSE:DIS) and Netflix (NASDAQ:NFLX). In this post, we’ll focus on the risks to Disney.
The merger between AT&T and Discovery poses a huge challenge two streaming entertainment companies. The new $43 billion media venture, vows to invest $20 billion a year on fresh content.
This is a game-changing development for the global media market. It's already been suffering from over-saturation.
Disney recently disappointed on revenue and subscriber growth—103.6 million subscribers compared to forecasts of 109 million—and Netflix's subscriber growth was also lower than analysts estimates, so investors are likely to be attracted to the new player on the block.
However, yesterday's merger news only caused a 0.25% drop in Disney shares, which we find surprising. Perhaps dip-buyers think the stock’s prior 7% selloff offers an appropriate entry point for a value investment?
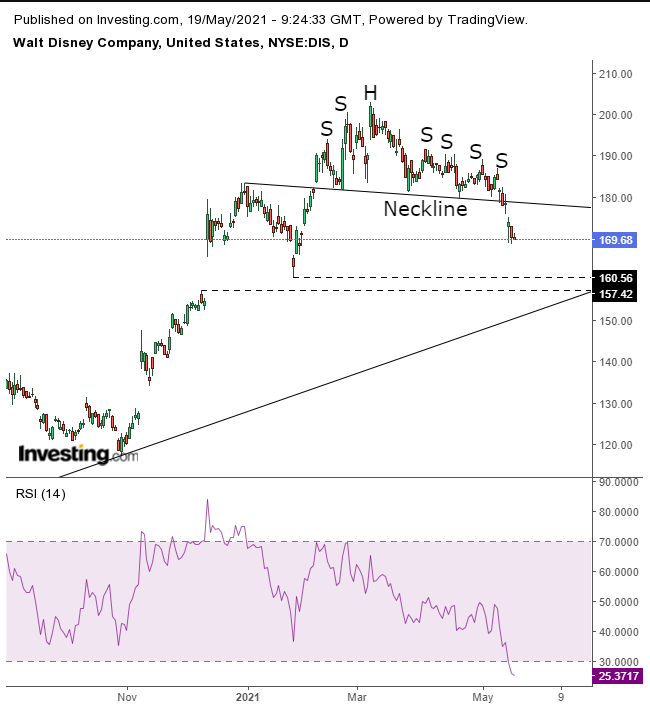
We don't agree. In fact we think this might be just the beginning of a deeper downfall. The technicals tell the story:

Disney shares have completed a complex H&S top, a pattern that illustrates demand had dried up, while supply increased, until the shifting supply-demand balance reversed the peak-and-trough formation.
After the first leg down, in the form of a downside breakout, there is often a return-move to retest the pattern’s integrity. The reason this happens is because the first leg down is a combination of closed long positions, diminishing demand, and increasing short positions which boost supply.
Because there's pressure from both sides, the downside breakout is often powerful. The pattern’s completion, a downside breakout, took the form of a falling gap—an area where there was only supply and no demand.
The height of this pattern, $21, implies the downside target from the point of breakout, aiming toward $158. Note how the chart comes together, at the point where the target meets with the Jan. 27 low, which confirmed the February gap’s support, the 200 DMA and the uptrend line since the 2020 bottom.
That will be a critical juncture for the company's shares. If they find support, the stock can return to advancing. If it breaks, the next support is in the $130s.
Trading Strategies
Conservative traders should wait for the price to perform a return move toward the neckline, reinforcing its resistance.
Moderate traders would sell with the corrective rally, for a better entry, without waiting for any further confirmation.
Aggressive traders could enter a contrarian long position, to ride on possible dip-buying, after the RSI fell to its lowest level since the March 2020 bottom and the price found support for a second day. They would then rejoin the rest of the market with a short. Given the complexity of this two-part trading strategy, a tight trading plan is necessary.
Here’s an example:
Trade Sample 1 – Contrarian Long Position
- Entry: $169
- Stop-Loss: $168
- Risk: $1
- Target): $176
- Reward: $7
- Risk:Reward Ratio: 1:7
Trade Sample 2 – Short Position
- Entry: $176
- Stop-Loss: $180
- Risk: $4
- Target: $160
- Reward: $16
- Risk:Reward Ratio: 1:4
Authors Note: You must learn how to customize a trading plan to your timing, budget and temperament. Till then, use our samples, but for your learning purposes, not for profit, or you’ll end up with neither. That’s a promise.
