By Pinchas Cohen
Stock valuations have only been this high twice historically—in 1929 and in 2000—right before the markets crashed. This week, a ballistic missile invaded Japan’s airspace, yet Japanese traders resumed their work with a sense of business-as-usual, trading up stocks. Some might consider that an obvious sign of complacency.
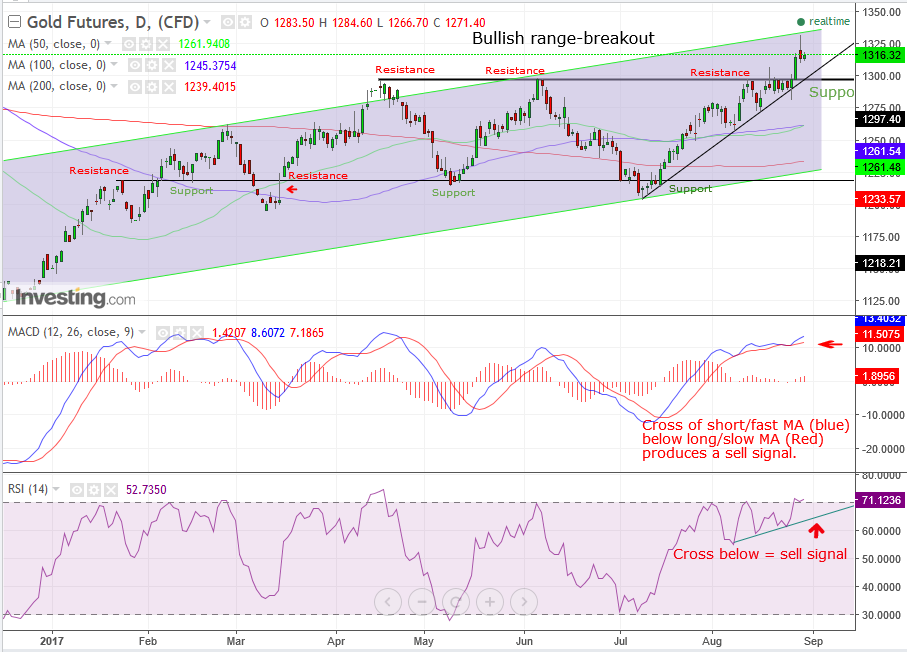
Gold has broken out of the range in which it has been trading this year. What does this technical event suggest about investor understanding of market fundamentals? The end of 2016 was marked by the animal spirits that ravaged through the herd, in which even grass-eaters turned carnivorous when gold fell 14.5 percent.
Since the beginning of the year, 2017 has been defined by investor indecision between risk-on and risk-off sentiment, with gold ranging between $1,200 and $1,300. Perhaps the upside breakout of the yellow metal suggests investors have decided in favor of risk-off with the death of animal spirits.

The upside breakout increases the probability of triggered stop-losses and unwinding of trades, which have the makings of the first layer of a psychological snowball that's $1000 thick, the size of this year’s range.
However, before rushing to purchase contracts, note that gold bulls are not out of the woods just yet. As was shown yesterday when the bears fought back, they're still inside the woods waiting.
During yesterday's trading, gold formed a bearish shooting star, which coincided with price reaching the resistance of the channel-top, while both the MACD and RSI are primed to provide sell signals.
New Buying Opportunity?
That’s a good thing since a downward correction would provide a better entry point. However, it wouldn’t be the perfect dip-buying opportunity. As mentioned, the price reached the channel top, which creates the potential of a downward correction, all the way down to the rising channel, which per today’s angle is at $1,226.55. However, by the time the price would return from the top, the channel bottom would probably have reached the $1,260 level, where the 50 dma (green) is set on crossing above the 100 dma (blue).
Such a successful crossing may be a bullish indicator called a “golden cross." But a failure, in which the 100 dma “resists” the 50 dma, may be viewed bearishly. However, considering the range-bound nature of market dynamics this year, the efficacy of moving averages in this case should be questioned. By definition, range is antithetical to movement, which is what moving averages are meant to measure.
Having said that, we are confident in the bullish signal provided by the 200 dma (red), which has neared the channel-bottom and is turning up, suggesting even the longest average of prices found support at the channel bottom and is set to rise, which would confirm the bullish implications of the breakout and ensuing support of the $1,300 key level and range top. Moreover, the 200 dma is on the rise for the first time since the price crossed above it on February 3, 2016. The price proceeded to rise 11 percent from $1,130 to $1,260, between February 3rd and February 11th.
Trading Strategies
Conservative traders may skip this trade. The price reached the channel top and could correct further below the $1,297 breakout level, back toward the channel bottom.
Moderate traders would wait for a dip toward the $1,297 level before entering a long position, with a stop-loss beneath $1,297 and as far lower as the $1,281.40 low of August 25. However, if you’re willing to assume that risk, don’t exit the position without making a profit at least equivalent to the risk, with an advisable 1:3 risk-reward ratio, to increase the probability of a few bigger wins covering previous losses and incurring a profit.
Aggressive traders may wait on a long position for a dip toward the $1,300 key level, or at least the short-term uptrend line since July 10, with a stop-loss beneath the $1,300 level, $1,297 range top or $1,281 August 25 low.
Very aggressive traders may go short, with a stop-loss above the $1,334 shooting-star high, to ride the expected return-move toward the $1,300 key level or $1,297 range-top’s support. Then they should turn around and go long, as mentioned previously.
Amateur traders would jump in without an entry, exit and risk-reward plan. They will proudly consider themselves aggressive traders but will have nothing left after they lose all their trading capital.
